
The S&P 500 cash index (SPX) closed at 1340.20, down 23.41 points. Net loss about 1.72%. All three major indexes traded lower; notably, the SPX slipped back to its breakout levels from the prior week.
The first week of May was filled with drama.
The bin Laden killing fueled an overnight rally Sunday which did not carry through in the day sessions.
Then three separate employment reports sparked sell-offs for two straight days before a rally on the next.
And then an increase in margin requirements on the silver futures contract led a heavy decline in commodity prices generally, and concerns about slow economic growth triggered a melt-down in oil prices. An interesting week.
This is an excerpt from the free Weekly Market Preview published by Naturus. To see the full document, visit http://naturus.com
SPX Weekly chart
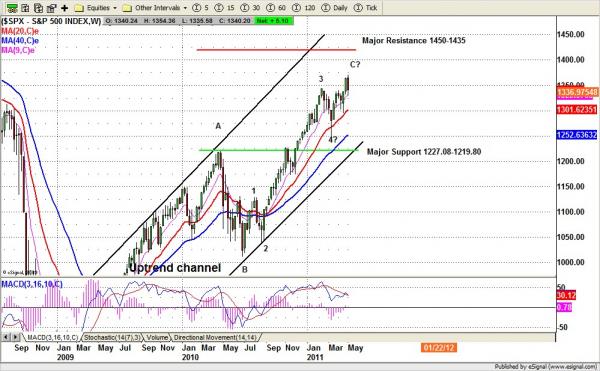
Technical analysis
Based on the SPX weekly chart (above), price first broke out of the first quarter consolidation range (1300-1345) and closed at the high level.
Then the following week, SPX pulled back down to its breakout level 1340 area for testing.
For the long- and intermediate-term, the pullback last week hasn’t done any damage.
The price can move down as far as 1320 area without changing the major trend direction.
Only if the price goes under 1320 line and closes under 1310 will we see the first warning signal that the intermediate-term trend may soon change its direction.
As long as 1320 line holds up, the bulls will not easily give up on buying around the 1320 support area.
When/if the bulls regain control above 1356-58 range, a final push up to 1386.14 (or higher to complete C target 1411-1430 range) will still be possible.
For the short term, there is a slightly different outlook for the SPX.
Based on a bullish inverted H&S pattern, the recently pullback for testing broken neckline is necessary. But based on closing price, the negative move on Friday was troublesome and arouses our concern.
The price was unable to carry through the gain and closed under Feb monthly high, which could indicate the previous week breakout move was fake.
A further decline could continue carrying the price down to short-term uptrend line around 1320-1319 area. A move under 1316 will be bearish. It will encourage bears to favor 1290 area for testing.
The short-term momentum indicators were oversold, while the intermediate-term remains overbought.
The declining volume was heavier in last three days trading. If SPX fails to push back up to 1356-58 range, it is likely for price to fall again.
Monthly resistance 1385 and support 1300; Weekly resistance 1375 and support 1300

