
The S&P 500 cash index (SPX) closed at 1199.73 on Friday for a net weekly gain of 0.52 points, just barely black for the week.
Fears about a Chinese interest rate hike and Irish debt levels re-emerged early last week and the markets sank on Tuesday, but later a possible bailout for Ireland was rumored and the GM IPO resorted some confidence. Plus positive economic reports showed that a recovery might be under way. By the last day of the week and option expiration there was enough good cheer to close in the black. Barely.
This week is dramatically short. Thursday the markets are closed for the Thanksgiving holiday and Friday they are only opened a half day. The volume will be thin. (Our chat room will close Wednesday afternoon and re-open Monday Nov. 29). Trading today (Nov. 22) will be important in determining which direction the market will go in this drastically-shortened week.
Technical analysis
Weekly outlook – S&P 500 cash index – SPX
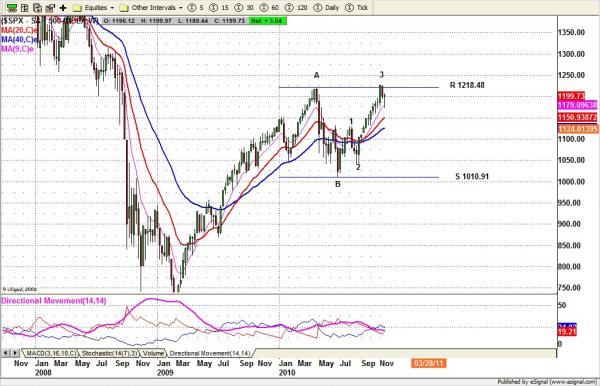
Based on Elliot wave structure, the wave 3 top seems to have formed and the decline last week is one of wave 4. As long as S&P 500 (SPX) stays under 1206 level, the decline should resume soon.
But there is an alternative possibility. If SPX moves back up to the November high area, it indicates that wave 3 hasn’t completed yet. The price could then go higher to challenge the major resistance level in the 1237-1250 range.
Comment
November to May is usually a favorable season for investors – the market makes most of its gains for the year in this period. But this year this seasonal pattern may be disrupted, because September and October, which are usually negative, turned out to be the most positive months this year. We can’t be sure Nov and Dec will follow their historical pattern. So we have to focus only on major resistance and support levels instead.
The latest sentiment report by Investors Intelligence showed 56.2% bullish last week, the highest level of bullishness since Dec. 2007, which was a couple of months before the bear market started. Treat this as a possible early warning sign.
Monthly resistance 1250 and support 1145; Weekly resistance 1225 and support 1175
Daily Outlook – S&P 500 e-mini futures ESZ0
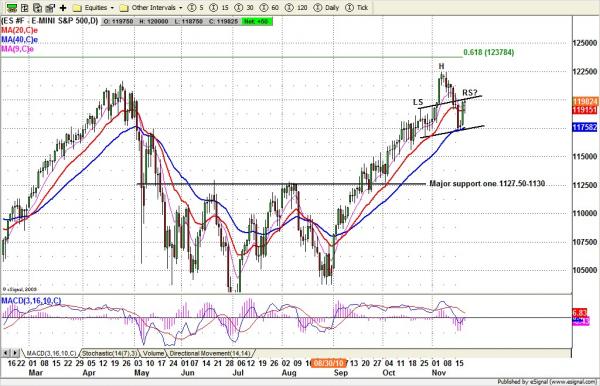
ES has a potential H&S pattern on the daily chart. If this pattern holds, the price should not go above 1205.75 line today. Instead the price needs to go under 1190 line to encourage the bears to keep selling. But this is a holiday week, and lots of traders will take off early for the holiday. The decline may be postponed into the following week.
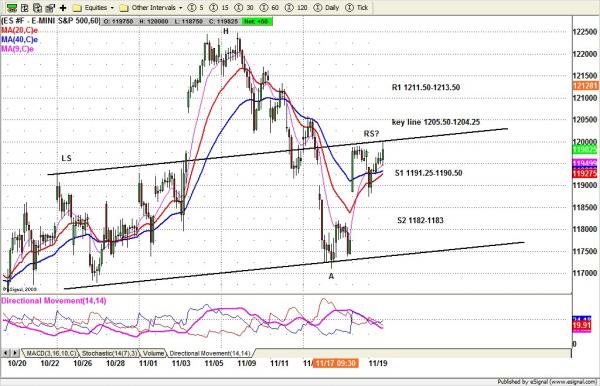
Intraday chart – ESZ0 60-minute bars
Daily trading strategy
The 1204-1206 range will be very important for today’s trading. As long as ES can hold this range down overnight and pre-market, price could go down to retest 1189.25-87.50 (Friday’s low area) again. A break above 1206.50 line could push price up to 1211-1213 (short entry) to attempt to fill the 1211 gap. A move under 1187.50 line will lead to a stop run and push price down to 1182-79.50 range or lower to 1177-1174.75 area (long entry) to retest the weekly low range.
To learn how you can monitor Nat’s real-time service for a week for just $1 visit this page

