
The S&P 500 cash index (SPX) closed at 1146.24 on Friday, for a net loss 2.43 points from the previous weekly close.
However SPX closed up strongly for September, rallying 8.8% for the month. Is the September rally now over? The Dow settled above 10800 for the second week in a row, and SPX held up the August high for the weekly close although it was down a little last week. There is still some energy left to drive the market higher.
This is the first week of October, and the first day of the week is very important for us. If Monday holds the price up, it is likely for the market to move up or hold up for the rest of the week.
Technical analysis
SPX Daily chart
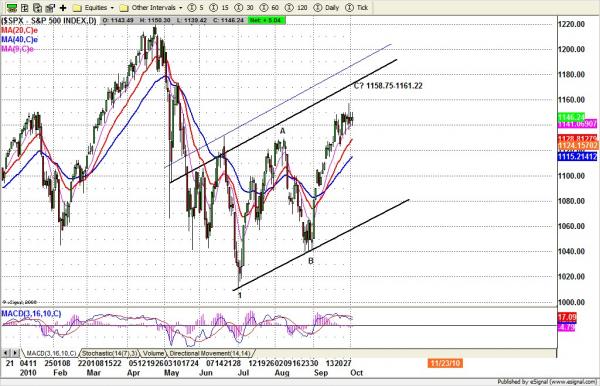
The SPX struggled between 1150-1140 for most of the time since it broke the August high 1131. 1150-1130 is an important range; 1150 was mid-Jan major peak, and 1130 is currently the first major support — formerly the major resistance level.
SPX is still a little below the projected C top area 1158.75-1161.22. Last week the SPX hit 1157.21, a few points from the C top. If the price still holds up 1130 this week, the price will continue to challenge the C top area before the upside momentum gets totally exhausted.
Daily outlook – S&P 500 Miuni Futures (ESZ0)
ESZ0 Intraday – 60-minute bars
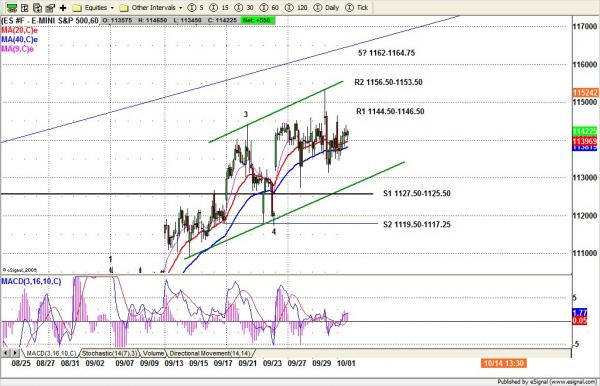
ES has formed a rising wedge pattern on the daily chart. If the price is pulled below 1124, it will be slightly bearish. It indicates that a short-term top has been posted, and a further move down to 1105-07 area would be expected in the next few days.
If price is held up above 1130-28 range, it would indicate that ES still wants to move up to retest 1153.50 or make a shakeout move up to 1162-65 area.
To see the complete preview for the week, including the trading strategy for Monday, visit www.naturus.com. Free registration required.

