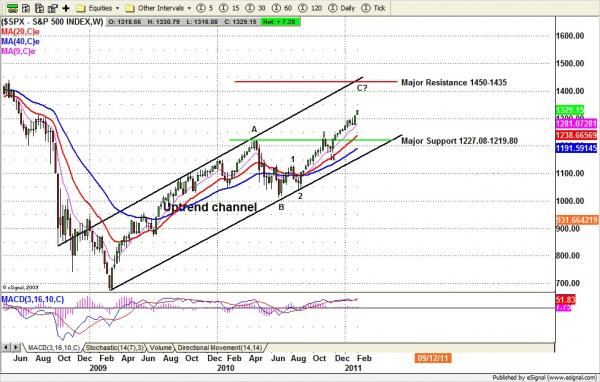
The S&P 500 cash index (SPX) closed at 1329.28 on Friday, up 18.28 points on the week for a net weekly gain of about 1.39%.
All three major market indexes ended last week solidly higher. The Dow, S&P 500 and NASDAQ all rose to a string of new multi-year highs, despite unrest in Egypt and interest rate increases in China.
At the end of the week the Dow held up above 12000, S&P500 held above 1300 and NASDAQ above 2800. The Russell 2000 orivided more encouragement for the bulls, holding above 800 level, which added fuel to last week’s rally.
This is option expiration week, which has been a pretty volatile period for several years. There are also significant economic reports due this week which should add to price swings as well. It may be a bumpy ride for both sides.
Weekly chart – SPX

Last week, for the first time the long-term momentum indicators gave a “buying signal” while the medium term indicators gave an overbought condition signal for the SPX, also a first.
If we only read the indicator numbers the signals seem to conflict. But as long as bulls are accumulating positions for the long term, the overbought condition in the medium term can continue for quite some time.
In our view the uptrend has not changed yet in either the long-term or the medium term.
We also believe the short term is still bullish, even though the price is in extremely overbought territory again.
In the last two weeks, the SPX appeared to be setting up for a retracement; but instead strong price action pushed the market up to new highs. This action was unusual, and it shows that this market was in accumulation mode.
However there is a potential resistance level ahead at 1363-1375, the yearly breakdown range in 2008. And bull rallies often look strong until suddenly they don’t; be cautious on the long side.
For option expiration move, 1325 is the battlefield for SPX. Bulls will try to fight for 1335 or higher up to 1350 and bears will try to fight for 1310 or lower to 1300 level.
If the price crosses either of those two extreme lines 1350 or 1300, expect volatile move; the move up could expand into up 1365 or on the downside, to 1285.
Monthly resistance 1350 and support 1250; Weekly resistance 1350 and support 1280.
Nat is currently running her mid-winter special: you can use her service for a month at 50% of the regular subscription. See the details on this page: http://naturus/com/half.html.


