
ES held above its first major support line (9-day ema) again yesterday. But the 1144.50-45 area seems a formidable resistance area for ES. Every time price moved near that area, the sellers stepped in and pushed the price back down above 9-day moving average area and stopped. The slow seesaw move makes price slow and choppy. Today’s price action may be more of the same.
The price movement around the current top consolidation area indicates the current rally is going to end soon. So far it lacks one final thrust up to 1156-62 range to shake out the weak hands. Today is the last day of September and the last day of the third quarter, when benchmarks for mutual fund performance are set. The price may repeat yesterday’s move to close the quarter at a favorable level.
The price should stay above 1117.25 for the monthly close today and above 1127.25 for the weekly close on Friday. If today there is a close below 1117.25, it would indicate that a short-term top has been posted, and a further small correction should be expected.
Trading strategy for Sept 30, 2010
ESZ0Intraday – 60-minute bars
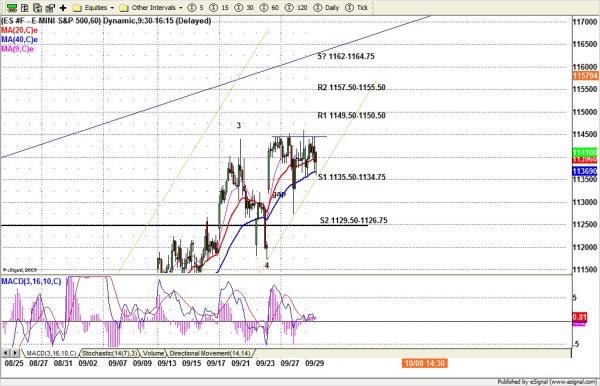
On the 60min chart ES went sideways again. So far we see strong resistance around 1144.50-45.25 area (RTH) and 1149.75 (Globex). If price can break out 1145.25-49.75, the upside momentum squeeze could push price up to 1156-58 (short entry) or higher up to 1162-64.75 (short entry). After ES reaches those levels, the price may fall back down fast if the upside momentum suddenly disappears. Especially if price goes under 1135.50 the uptrend channel will be broken, and a further decline to 1132-29.50 should be expected.
To see more of Nat’s market analysis, visit www.naturus.com. Free registration required.

