
ES struggled around the top band of the uptrend channel yesterday and made very little gain from Friday’s close. Basically the rally should be ended around 1163.75 area. Yesterday ES made just slightly higher than 1163.75 during intraday trading. The price remained under 1164 for rest of day.
Volume is anemic. This could caused by the holidays in Canada and the U.S., or investors may want to wait for the FOMC minutes release today before they make the next move. Intel’s earning report today could set the tone for the next few days.
Today ES could pull back down further if it fails to break out 1166.50. 1153.50 is today’s key line. A break below this line could lead the price further down to 1145-43.50 range. A close under 1142 will give a warning signal that a short-term top has been posted.
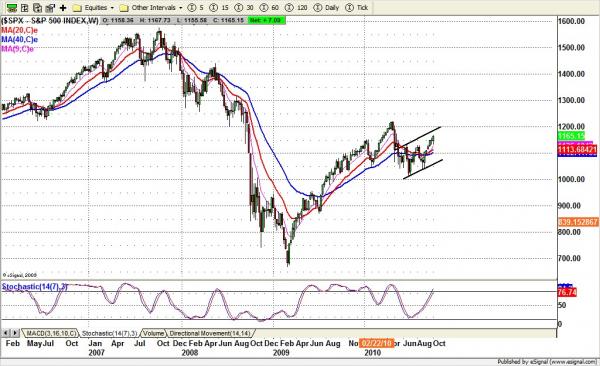
The Fed may still want to hold this market up even as it engages in competitive devaluation and an expanding currency war. But the upside potential is fading, and there is lots of room on the downside.
TRADING STRATEGY FOR Oct 12, 2010
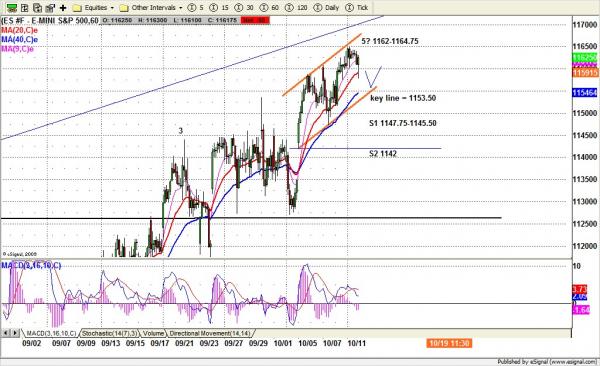
On the 60min chart, ES seems to be forming a rising big M pattern. Today ES could pull price back down to 1153.50 before it makes another bounce if overnight trading fails to break out 1165. A move under 1151.50 could lead price down further to 1145.50-43.50 range (long entry). In any decline the 1142 line needs to hold ES up; otherwise, the drop could be fast and nasty.
To see more of Nat’s market analysis visit www.naturus.com. Free registration required.

