The S&P 500 cash index (SPX) closed at 1183.26 on Friday for a net weekly gain of 0.18 points, and a monthly gain of 42.06 points, about 3.7%.
In the past week, the SPX mainly went sideways most days to wait for the mid-term election results on Tuesday and the Fed QE2 stimulus announcement on Wednesday. The Dow managed to close above the 11100 level.
Technical analysis
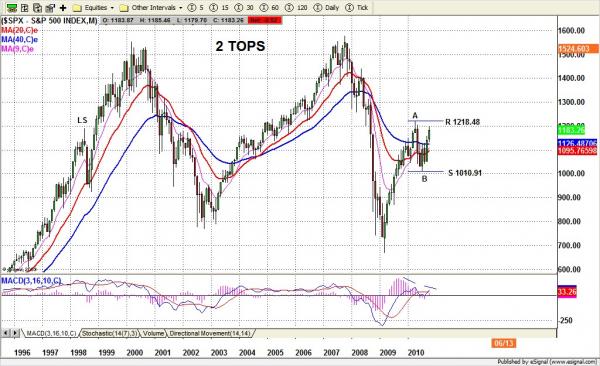
On the long term chart (monthly) the price rallied from July’s low and approached the April high area again. Looking back at the historical data, the 1200-1250 high has been a very important area in many years. It was the 1998 high level. This level was broken out two times, in both cases bubble bull markets followed by excessive bear markets. Now the price is around this level again. A move above 1250 line will indicate another bubble bull market may be seen.
Based on the weekly wave movement, the SPX remains inside the wave 3 of C move. It looks like this wave 3 needs to go up and retest 1218.48 first before it makes another small correction wave (4). But our momentum indicator (MACD) shows the wave 3 is in the last stage, so a pullback into 1159-55 area is possible if SPX fails to breakout 1218.48.
Based on our time cycle the SPX is also near the end of the current cycle. Our CIT day is around Nov 8 or 11. The past price behavior reminds us that an A round TOP pattern is going to form and a correction move could start around our CIT day, plus or minus 1 day.
The market expects the Republicans will be the majority party in the House after the mid-term elections. Moreover, the QE2 program will probably be announced on November 3rd. Any surprise in the election or the stimulus package will rock this market. There is lots of uncertainty.
Monthly resistance 1250 and support 1145; Weekly resistance 1225 and support 1155
SPX Monthly chart
 hly
hly
E-mini futures contract (ES)
Daily chart – ESZ0
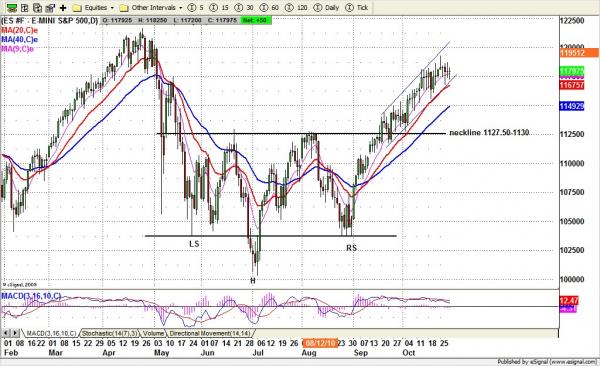
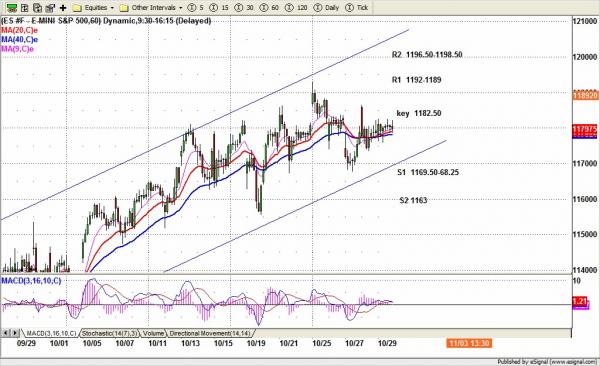
The ES was traveling inside a rising channel and tried to hold price above the 9-day moving average. The price shows little inclination to go anywhere. The purpose of this move could be to kill time. ES is due for a correction. Because of the election and many external interventions, the price has been holding up since the higher low (1155.50) made on Oct 19.
Today two things might occur. One is ES continues sideways to wait until Wednesday In the early morning ES may pullback down a little and later move back up for closing, which mainly means no or little change from its previous close.
Or ES could make a spiking high first in the overnight or early morning to retest last week’s high area 1193-1196 to see if there is any chance to bring more buyers to the market.
Trading strategy for Monday
Friday ES made a narrow range day again. Today a move above 1186.50 will lead ES up to 1193-96.50 area (short entry) to retest last week’s’ high area. A move below 1165 will be bearish. It indicates that the short-term top has been posted. A further move down to 1153-55 area (long entry) should then be expected. HFT could make the price movement very choppy.
To see more of Nat’s market analysis, incuding her market preview for the week, visit www.naturus.com. Free registration required.
ESZ0 Intrday – 60 minute bars