
The S&P 500 cash index (SPX) closed at 1189.40 on Friday for a net weekly loss of 10.33 points, slipping about 0.8%.
It was a holiday-shortened week, but the cheerful holiday sentiments were overshadowed by many unexpected events. First, the FBI investigation into several major hedge funds for insider trading. Second, the two Koreas were firing at each other. Third, renewed worries over euro zone debt. For the week, SPX lost a little but was still on track for gains in November.
This is the end of November; and the usual end-of-month window-dressing may come into play. A likely scenario is a little pullback on Monday, with bounces on Tuesday and Wednesday to welcome the new month. The price may repeat last week’s range again. Also lots of economic reports to watch this week.
You can get premium member access to Nat’s service for a full week for just $1. Follow this link for details.
Technical analysis
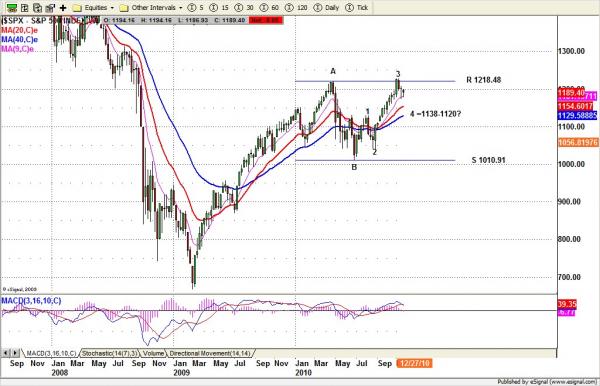
Based on SPX weekly chart, the declining move in past two weeks seems to be part of wave 4 processing. The wave 4 could be making a sideway move if 1173 holds up; alternatively, we may see a decline to 1138 or lower to 1120 area if SPX breaks down the 1173-1171.70 range.
Last Friday SPX formed a NR4 pattern, which is a compression move. The market winds like a spring, and then expands in one direction or the other. The narrow range could be the trigger point that releases the contraction for early this week, especially early Monday’s trading.
The breakout could be in either direction. Watch for a break-out of Friday’s high or a breakdown of Friday’s low to determine the direction of the new trend.
So far, based on last Friday’s closing, we expect a continuation low move should be seen first. But Friday was only a half-day of trading and this is the holiday season, so a move back up to test Friday’s high is also possible.
Monthly resistance 1250 and support 1145; Weekly resistance 1200 and support 1175
Daily chart – S&P500 Mini Futures (ESZ0)
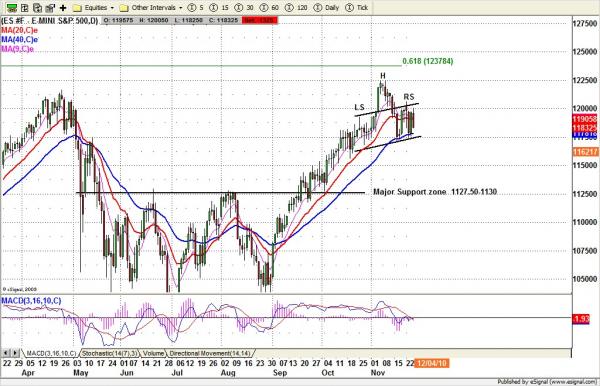
ES has a H&S pattern on the daily chart. So far 1206 holds for the right shoulder top. As long as ES doesn’t breach that high, the sideway move could diminish the strength of support around the daily moving average lines.
A break below 1171 will be bearish. The next major target for the decline will be the 1143.50 area, which is the full measurement of the downside target for a breakdown from a H&S pattern.
In the past four days trading, ES gapped both up and down on relatively light volume. Today most people will be back from holidays, and the volume should return to normal. Last Friday’s high will become a key line for today’s trading. If we fail to breakout last Friday’s high, ES could pullback to make a lower low.

