
The S&P 500 cash index (SPX) closed at 1225.85 on Friday for a net weekly gain of 42.59 points, about 3.6%.
Many thanks for Fed QE2 plan. Last Wednesday the Fed announced $600 billion QE2 plan, and the next day, the newly-printed money went into the stock market non-stop to buy every dip. As a result, SPX gained more than 1.8% on Thursday and broke the April monthly high and closed near the high.
SPX Daily chart
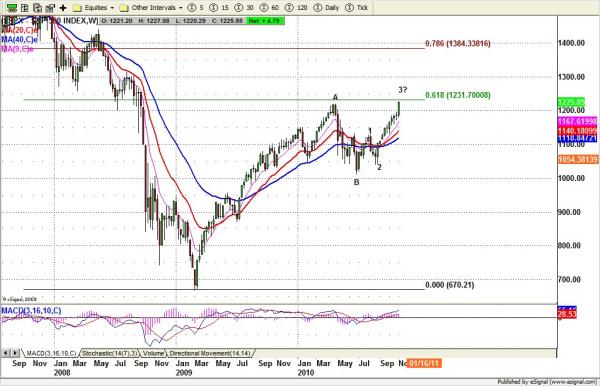
On the long term, SPX approached its major key area 1229-1240, which is 61.8% retracement zone from Year 2007 high to Year 2009 low. A move above 1250 line will indicate that we will see another bubble bull market like the year 2000.
Based on the weekly wave movement, we may see SPX to form a sub wave 3 top around 1229-1240 area. But all our momentum indicators say the uptrend will remain intact. The major C top is likely to be reached before SPX can do a decent correction. Before SPX reaches the C top, there are also several major resistance levels ahead. The First one should be Aug.8, 2008 gap 1305 area, which overlaps Gartley Pattern major target.
This week is a key time cycle. If this week SPX can form a bottom for next high move, by the end of this year we should see the 1305 gap filled. If SPX finds the top, we may get multiple weeks of small correction. But regardless of the correction, the price should not break down 1130-1125 area.
Fundamentals
We are entering an international financial war, with ‘quantitative easing’ — devaluation of the USD — as the weapon of choice.
U.S. trading partners will have no alternative but to devalue their own currencies versus the USD, and explore other strategies — protective tariffs and currency restrictions — that will hinder international trade.
Gold and commodities are already showing large price increases as denominated in USD. Eventually — soon — these price increases in raw materials will be reflected in U.S. domestic prices. The investing class is already looking for non-USD assets — like gold —to preserve the value of their assets while the US currency devalues.
QE2 implies nothing but bad news ahead for the U.S. economy. The Fed’s purpose is to increase the price of financial assets by reducing the value of the currency we use to measure them, in hopes the U.S. consumer will feel richer and spend more. The harm caused to other nations and international trade by debasing the global reserve currency is merely “collateral damage.”
With $100 billion in new money entering the markets each month until June the nominal price of financial assets will surely rise. But the risk of collateral damage spilling over into the U.S. economy is rising with it. This looks like the next bubble. Even little guys know it. So does Ben.
Monthly resistance 1250 and support 1145; Weekly resistance 1250 and support 1200
The Futures – ESZ0 Daily chart
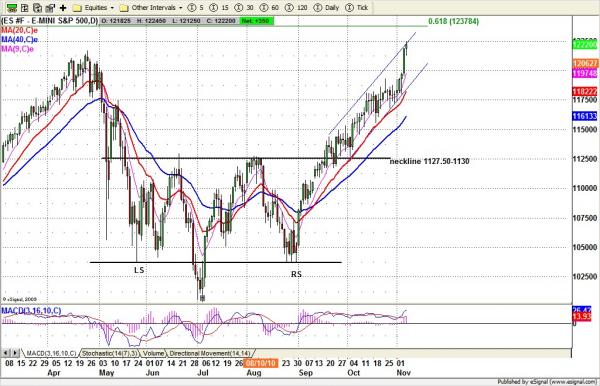
ES broke yearly high around 1216.75, and closed above it for the first time Friday. This week ES will continue to challenge new highs if it manages to close above 1216.75 line.
Today we may see a small retracement from last Friday’s high. 1203-1197 could be retested today or tomorrow. After Wednesday, price is likely to move back up if ES can still manage to hold above 1200.
A move below 1180-1179 range will be bearish. Price could be pushed lower around 1173-1167.50 range. But we will see buyers on every dip. In other words, don’t expect that correction will be big.
To see Nat’s trading strategy for Monday Nov 8, download her fiull market preview at www.naturus.com Free registration required.

