The S&P 500 cash index (SPX) closed at 1224.71 on Friday for a net weekly gain of 35.31 points, up about 3%.
In the first two days of the week the SPX and DOW looked like they would break down due to negative news from Europe and China. But on Wednesday the DOW and SPX reversed and surged to the upside, pushed by mostly positive U.S economic reports, including gains in consumer confidence, manufacturing activity, retail sales and auto sales (but not Non-Farm Payrolls).
At the end the Dow regained the 11300 level, while the SPX climbed back above 1200
This week we may see a small pullback move to smooth out the over-demand created last week. Also rollover day will be on Thursday. A pullback or sideway move is a necessary condition to form a support for the next leg up.
Note that we saw a rally after the Black Friday retail frenzy. Usually that indicates more upside on the way to the end of year, once a small correction is over this week.
Technical analysis
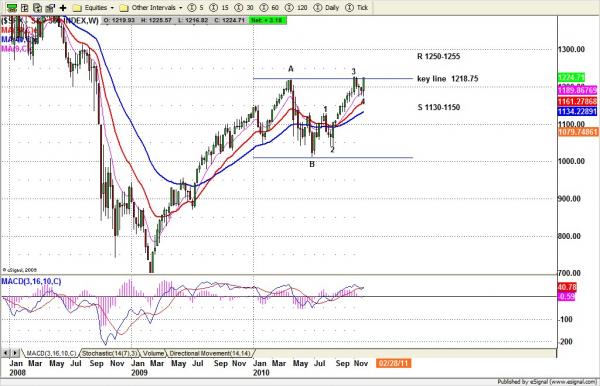
S&P Cash index (SPX) Weekly chart

Based on Elliot wave movement, last week’s low could be the low of a wave 5 move or an A low of wave 4. Here is the analysis:
- If SPX can’t breakout the Nov.5 high 1227.08, the wave 4 processing will continue and last Friday’s high 1225.57 area is likely the B top. This week the price might drop back down around 1190 — or, if it reaches the maximum retracement, around 1178 — to form the C low of wave 4. Once wave 4 completes, wave 5 will be on the way.
- But if SPX can manage to breakout 1227.08 and go up to 1236-1240 range, the outlook will turn out differently. It indicates wave 5 is already in process and the price could move higher to 1250-1255 to complete this year’s inverted H&S pattern before the end of this year.
Monthly resistance 1250 and support 1145; Weekly resistance 1250 and support 1180
S&P 500 e-mini futures – Daily outlook
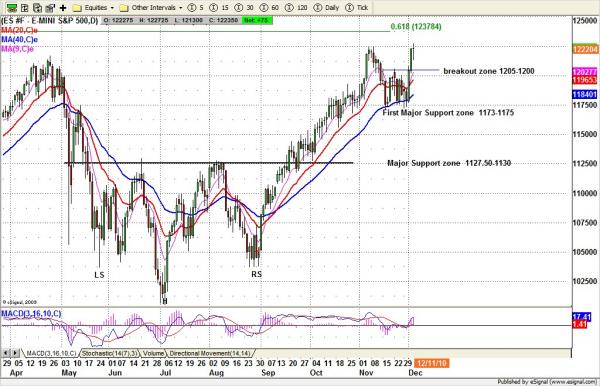
ESZ0 Daily chart

Last week ES broke out from a two-week consolidation range from 1206 to 1173, and made a strong range breakout move. So far this price move must be considered bullish.
But the trading volume is decreasing in the last three days compared with Tuesday’s down volume. The divergence between high price and low volume may not support the expected high continuation move early this week.
Second, there is inter-index non-confirmation on Friday’s trading. SPX and DOW didn’t exceed their Nov. 5 high and did not give a confirmation from the Transportation index and the small cap exceeding the Nov. 5 high. This may be a hint that either B top of wave 4 is near or ended, OR, that at least a small pullback should occur.
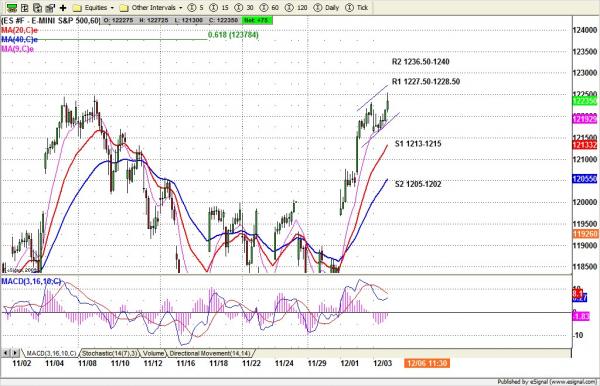
ESZ0 Intraday chart

You can subscribe to Nat’s service for 50% off the regular price. But you have to sign up by midnight Tuesday. Here’s the link for more information.


