
The S&P 500 cash index (SPX) closed at 1369.10 on Friday, down 34.26 points for a net weekly loss of 2.4%.
Last week was a strong shakeout week. SPX ran up strongly on the first day of the week and sold off on the last day in response to weaker-than-expected non-farm payrolls.
This week the results of French and Greece election will influence EURO movement directly and the US market indirectly. Many traders will focus on possible QE3 hints from Fed officials delivering speeches next week. SPX could go down first in the early week and bounce up later in the week.
SPX Weekly Chart
Technical analysis
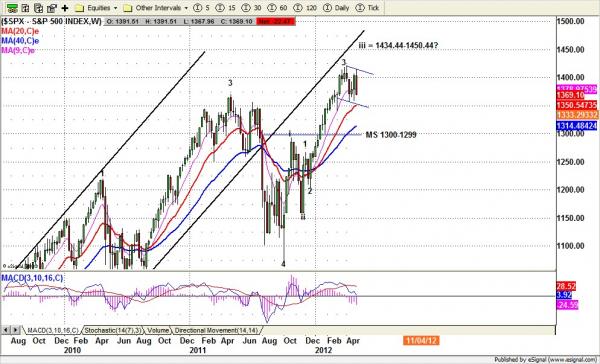
Based on the weekly chart (above), SPX failed to make new highs above March’s top. 1415.32 could be another short-term top with the next low around 1350.
Based on Wave principles, SPX may still be in sub-wave 4 of wave iii. Last week’s pullback could be one correction move of sub-wave 4, which could have a target around 1350.32 area. We may see SPX hold up this support level and push price back up to squeeze shorts again.
There is a potential bull flag pattern on the weekly chart, although the bearish H&S pattern on the daily chart is currently attracting comment from everyone on the Street.
For the long term, the SPX hasn’t broken any of its major support lines yet. The current declining move may be just a threat to ask for QE3 from the Fed.
The CBOE market volatility index hit 19.16 last Friday. The current selling didn’t evoke any fear. It indicates there are some buyers still betting on buying stocks. In addition, we are only halfway through the April/May earning season; good earning reports may help to hold the SPX up.
Monthly resistance 1450 and support 1325; Weekly resistance 1395 and support 1350.
To see the complete analysis, and the Naturus free weekly preview for gold, oil, bonds and the Euro, visit www.naturus.com.

