
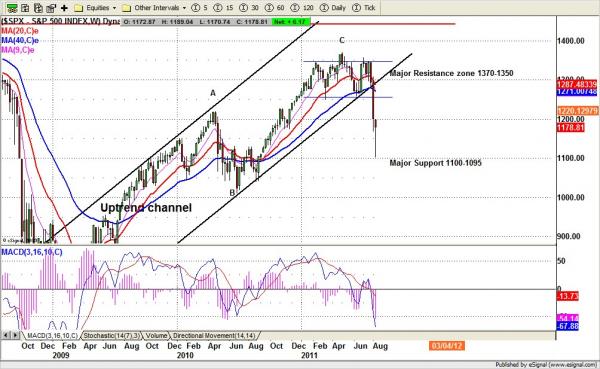
SPX Weekly chart
The S&P 500 cash index (SPX) closed at 1178.81, down 20.57 points or about 1.7% — a smaller loss than the previous week.
Last week the stock market had its most volatile action since 2008. Traders around the world felt the reaction from downgrade uf U.S. Debt and the and Fed’s language on extending the period of low interest rates.
This week is option expiration week. We may continue seeing some price action moves, but it won’t be the same as the dramatic gains and stomach-churning losses of last week.
Technical analysis
Based on the SPX weekly chart (above), SPX made a morning star on last week’s candle, a pattern that suggests the price may have made its short-term bottom.
In addition the weekly momentum indicator (MACD) also moves into oversold territory. SPX could pop up further or go sideways for consolidation to smooth out the oversold condition in preparation for the next leg of this move.
1100 is currently a strong support area, at the point where two Fibonacci retracements overlap: the 38% retracement from the major high 1373.50 to major low 665.75 for the long term; and the 75% retracement from 1373.50 to 1002.25 low for the intermediate term.
The price could hold up this support for a bounce. Once the bounce gets totally exhausted, we may see another leg down to retest this support and challenge new lows.
So far SPX lost its first major psychological support at 1200. The total move over the past three weeks did lots of damage on the short-term and intermediate-term. But for the long term, it still hasn’t got a final confirmation yet.
If this week the 50-day moving average line crosses under the 200-day moving average line on the daily chart, we will then have a clear selling signal on the long run and officially declare that bear market has started.
The market volatility index did challenge the 48 area on Tuesday, and closed under 36.36 line on Friday. For bulls, the pop in the VIX may be very encouraging. But judging from past bear markets, it may still take several more weeks of extremes in the VIX before it reaches its peak.
The bottom line: After SPX broke 1200, the downside move surprised the bulls, and may continue to surprise them. The pattern that leads to a bottom needs to be defined by both time and price; so far we have only seen the price, but not the time.
Monthly resistance 1350 and support 1030; Weekly resistance 1250 and support 1100
This is an excerpt from the Naturus weekly market preview. To see the full preview, including the outlook for gold, oil, bonds and the Euro, visit www.naturus.com

