The ES made a small pullback during Wedsnesday overnight trading, then moved back and forth to slowly march up to squeeze the shorts. At the end, the bulls won again Thursday.
Now the price has moved above the 50-day moving average line (1078.25), which will act the first major support line, and encourage the bulls to stay in their positions. At the same time, Thursday’s price movement confirms our earlier analysis: the short term low has been posted.
Even thought about 50% of the volume was missing Thursday, the price behavior was still bullish. The price could make an internal correction to smooth out short timeframe overbought condition and keep pushing up onlight volume. This uptrend could last until next week if today ES continues ignoring suspicious economic reports (employment data) in the early morning.
1093.75-1095.50 is the key range for today. A move above it will be bullish and odds will favor a push higher. Holding under this key range is likely to move ES down to retest 1075-73 or lower to 1067.50-69 range, especially if the unemployment data is much worse than the street expects.
The easily-manipukated birth-death calculations will be applied to the non-farm payroll numbers this month, which probably means they will come in around expectations; butnwatch for them to be revised downward later.
TRADING STRATEGY FOR Sept 3 2010
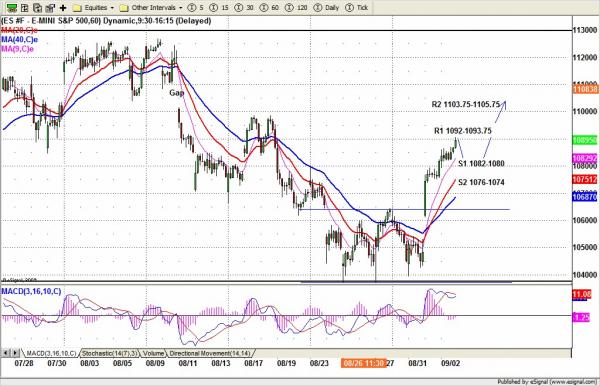
On the 60min chart, ES kept marching up toward the range breakout target 1092-93.75. Today it is possible to see that target in the early morning. If the unemployment report is good, a brief after-news sell-off could occur. But as soon as ES finds support around 1080-81 or lower to 1075-73 (long entry), the price will come back up unless the report is very bad. A move below 1067.50 will be very bearish.
ESU0 Intradayu – 60-minute bars