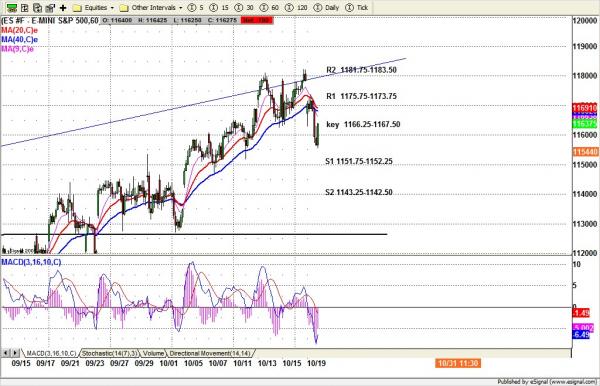
ES did exactly what we predicted in yesterday’s daily trading plan: a pullback move led ES down to retest support just above the 1153.25 area. This small pullback will not do too much damage on the daily chart. Just a hiccup.
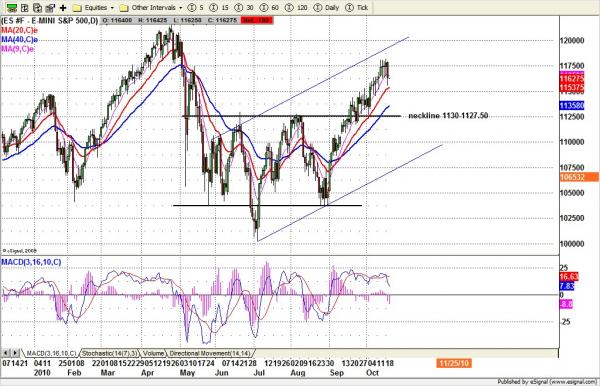
Today ES could make a consolidation move between 1168 to 1154 range if it can’t break down 1151 in the morning session. A break below 1148.50 will indicate that the pullback move wants to continue toward 1137-1134.75 area to fill the Oct. 5 gap. So far daily momentum indicators still suggest the pullback move will continue.
But Tuesday’s broad markets sell-off creates a price imbalance that could lead to a sideways move early today to re-balance demand and supply before the price resumes its next trend move.
To see more of Nat’s market analysis, visit www.naturus.com. Free registration required.
ESZ0 Daily chart
ESZ0 Intraday – 60 minute bars