ES finished August at the low end of the monthly range. Despite predictions that August would be positive for the markets, all three major indexes had their worst performance for August since 2001
There is a positive seasonal bias for this week, but so far the ES has not completed its first sub-wave of the declining wave 3, based on our Elliot wave count. Investors are reluctant to make a commitment on the buying side amid concern the economic recovery will fail. Tuesday’s FOMC minutes added to that uncertainty.
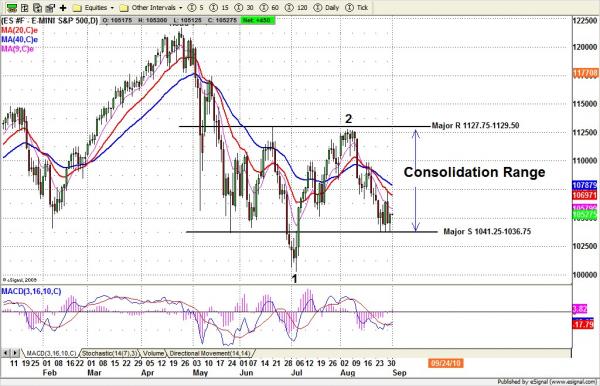
ES still holds above the major key line 1037. But every bounce from this line gets weaker and weaker. We may see ES continue consolidating for one more day. But we should expect a breakdown through 1037 soon. It is not certain, but it is likely.
ESU0 Daily chart
Trading strategy for Wednesday
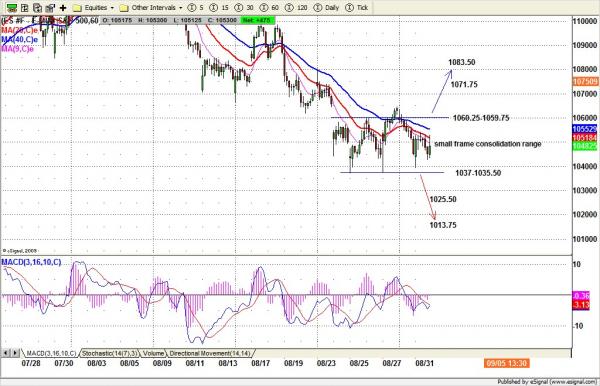
On the 60min chart, ES had a small timeframe consolidation range from 1060.25 to 1037. Today price could be holding up above 1037 for one more day and try to retest 1055 (scalping short) or higher 1060.25 (short entry) one more time to set the tone for the first day of September. But the price should not exceed 1083.50 line for this week. A break below 1035.50 will open the door toward the next major downside target 1025.50 or lower to 1013.75.
ESU0 Intraday