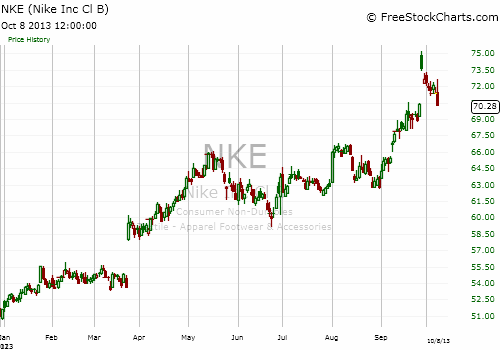
It seems a lot of people are Just Doing It these days. After all, Nike reported stellar quarterly earnings last month that led the price to gap higher by more than five percent. Since that time, the price has filled the gap, trading back down to close at $70.28 on Tuesday, but the stock is still higher by 36 percent year-to-date – more than double the S&P 500’s 16 percent rise.
Technically, Nike (NKE) looks strong. The stock is trading above the 50-Day Moving Average ($67.67) and 200-Day Moving Average ($63.95), which is one basic condition that Tradespoon’s algorithm identifies. Furthermore, in early September, the price broke out from resistance at $65 per share (see chart below). When the stock was able to pass this support level, the MACD indicator – an indicator of bullish or bearish momentum – showed bullish. Currently, the stock is trading near an all-time high with no resistance level ahead.

A LOOK AT FUNDAMENTALS
Nike’s short-term bullish technical indicators are supported by strong fundamentals, as well. In that latest earnings report, Nike reported that it earned $780 million, or 88 cents per share (86 cents diluted earnings per share), for the quarter that ended August 31. That’s higher by $567 million, 65 cents basic earnings per share (63 cents diluted earnings per share) for the same quarter last year. The increase was driven by multiple factors that indicate it can continue: strong demand; a decrease in raw material costs; a shift to higher margin products; lower discounts; and growth in its direct-to-consumer business.
Revenues for the quarter ending August 31 were $6.97 billion, up from $6.47 billion for the same quarter last year. In the quarter ending November 31, NKE is forecasted to earn 68 cents per share, up from 55 cents last year. The company looks very solid in terms of financials as well.
Nike’s trailing price-to-earnings ratio stands at 23.72, slightly above the industry average of 21.3 and above the S&P 500 average of 18.32. The stock is currently trading above the preferable P/E ratio of 15x; however, the current P/E is well within its historical trend of trading between 11.14 and 27.14 times trailing earnings.
NKE’s current Price/Sales of 2.47 is above the average of its industry (1.19). But, that shouldn’t be surprising given Nike’s status as the best-of-breed. In a head to head comparison to its main competitor, Adidas, Nike has slightly lower gross margin, but much better operating margin; earnings-per-share are higher; and NKE has superior quarterly revenue growth. Yet, the stock trades at lower P/E ratio than Adidas.
Nike is also currently trading below its intrinsic value of $82.51, suggesting that the stock is undervalued at these levels. NKE has shown favorable earnings consistency over the last five years. Furthermore, NKE’s earnings per share over the last five years have experienced growth of 12.33. Specifically, current quarter earnings grew by 35.38 percent compared to the same quarter last year.
OPTIONS STRATEGY RECOMMENDATION
Using that background, we are able to develop the following trading recommendation: Buy November 2013 $70 Calls and sell the November 2013 $72.50 Calls for a net debit of $1.10. We recommend holding until spread price reaches $2.30, which would correspond with a price of $72.30 or higher at expiration. Your potential loss is limited to the up-front premium ($1.10), while your potential profit ($1.40) is capped at the difference between the two strike points, minus your investment.


