

U.S. non-farm payrolls shocked traders Friday morning with a higher-than-expected reading. Non-farm payrolls rose to a seasonally adjusted 195,000 in June. The stronger job growth came with sharp revisions to April and May’s data that showed a combined increase of 70,000 more jobs than previously estimated.
The labor department also said that the unemployment rate remains unchanged at 7.6%, disappointing expectations for a decline to 7.5%.
This number has had an initial positive impact on the two main indices S&P500 Large Cap Index and the Dow Jones industrial average as well as the U.S. dollar index, and a negative impact on gold and treasuries.
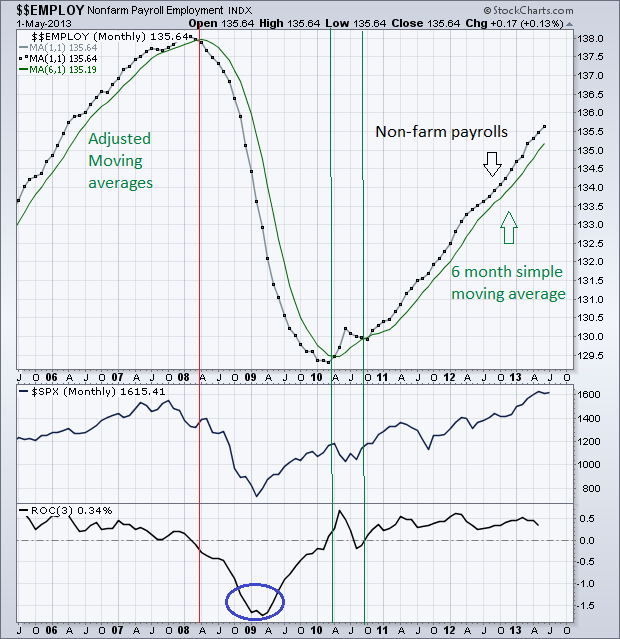
NONFARM PAYROLL EMPLOYMENT INDEX
After this good reading, let’s backtrack a bit and look at things from a broader view. Mr. John Murphy and his team at Stockcharts.com have recently added a new economic indicator to their database that has caught my attention: the Nonfarm Payroll employment index.
Although many economic indicators often lag the market, we technical analysts can use these indicators to understand the economic picture and see if it supports the current trend in stocks. Therefore we’re not looking for degrees of strength or weakness in these economic indicators, but instead we look at the general conditions to determine if the economic trend is in expansion or contraction. An expansion supports a long-term uptrend in stocks, while a contraction supports a long-term downtrend.
CHART ANALYSIS
The chart is plotted on a monthly scale and with some adjustments in the moving averages, pushing them forward one month in order to align the data release with the current price of the S&P500 large cap index.
On the chart we can see how the monthly indicator has bottomed out in the first quarter of 2010 and moved gradually higher these past 2 and half years. It’s a known fact that sometimes employment data often lags the economy.
CORRELATION WITH THE S&P 500 INDEX
We can see proof of this when the S&P500 peaked several months before non-farm payrolls turned down and slipped below the 6-month simple moving average. Similarly, the broad index bounced back well before the non-farm payroll growth turned positive.
Although there is a lag between the indicator and the S&P500 large cap index movement, it is still very valuable to define the long-term trend.
ECONOMIC OUTLOOK
The economic outlook turns negative when the 3 month ROC (rate of change) goes below the zero line and positive when the indicator pushes above it. The latter has been the case since October 2010.
Although the month to month gains seem small for such a huge economy, the key is to continue increasing and not decreasing.
This implies that we’re currently in an expansion phase, indicating that the bull market in stocks will continue.

