
By FXEmpire.com

NZD/USD Fundamental Analysis March 29, 2012, Forecast
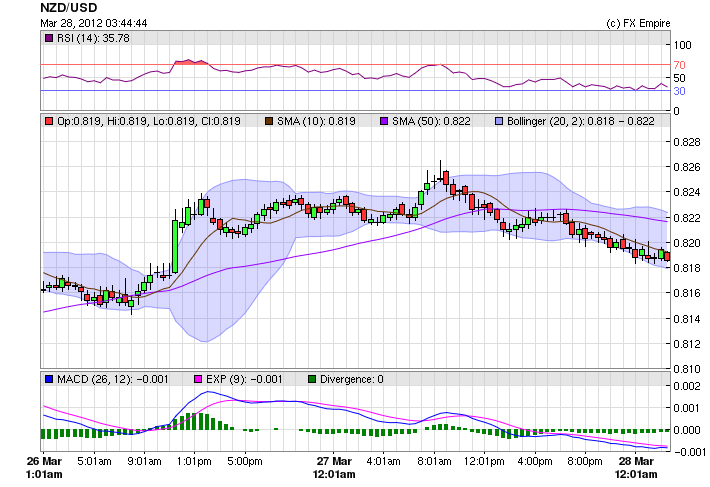
Analysis and Recommendation: (close of the Asian session)
The NZD/USD slid lost 0.3 percent to 81.83 U.S. cents.
The Australian and New Zealand dollars slid against most major peers as Asian stocks extended a global retreat, sapping demand for higher-yielding assets.
Both currencies are headed for their first monthly drop this year amid concern Chinese manufacturing will slow, curbing demand for resource exports. Australia’s dollar touched the weakest level in five months against New Zealand’s so-called kiwi before a report forecast to show annual growth in bank lending in the larger nation was the slowest since August.
Economic Data March 27, 2012 actual v. forecast
|
Mar. 27 |
JPY |
CSPI (YoY) |
-0.6% |
-0.4% |
-0.4% |
|
CHF |
Consumption Indicator |
0.87 |
0.93 |
||
|
EUR |
German Import Price Index (MoM) |
1.0% |
1.0% |
1.3% |
|
|
EUR |
GfK German Consumer Climate |
5.9 |
6.2 |
6.0 |
|
|
EUR |
French Consumer Confidence |
87 |
83 |
82 |
|
|
EUR |
Netherlands GDP (YoY) |
-0.6% |
-0.7% |
-0.7% |
|
|
HKD |
Hong Kong Trade Balance |
-45.8B |
-15.0B |
-8.9B |
|
|
EUR |
Italian 2-Year CTZ Auction |
2.352% |
3.013% |
||
|
GBP |
CBI Distributive Trades Survey |
0 |
-4 |
-2 |
|
|
TRY |
Turkish Interest Rate Decision |
5.75% |
5.75% |
5.75% |
|
|
HUF |
Hungarian Interest Rate Decision |
7.00% |
7.00% |
7.00% |
|
|
USD |
S&P/CS Home Price Indices Composite – 20 (YoY) |
-3.8% |
-3.8% |
-4.1% |
|
|
USD |
CB Consumer Confidence |
70.2 |
70.3 |
71.6 |
|
|
USD |
Richmond Manufacturing Index |
7 |
18 |
20 |
Economic Events March 29, 2012 that affect the JPY, AUD, and NZD
00:50 JPY Retail Sales (YoY) 1.4% 1.9%
Retail Sales measure the change in the total value of inflation-adjusted sales at the retail level. It is the foremost indicator of consumer spending, which accounts for the majority of overall economic activity.
13:30 USD Initial Jobless Claims 350K 348K
13:30 USD Continuing Jobless Claims 3365K 3352K
Initial Jobless Claims measures the number of individuals who filed for unemployment insurance for the first time during the past week. This is the earliest U.S. economic data, but the market impact varies from week to week.
13:30 USD GDP Price Index (QoQ) 0.9% 0.9%
The GDP Price Index measures the annualized change in the price of all goods and services included in gross domestic product. It is the broadest inflationary indicator.
13:30 USD GDP (QoQ) 3.0% 3.0%
Gross Domestic Product (GDP) measures the annualized change in the inflation-adjusted value of all goods and services produced by the economy. It is the broadest measure of economic activity and the primary indicator of the economy’s health.
17:45 USD Fed Chairman Bernanke Speaks
Federal Reserve Chairman Ben Bernanke (February 2006 – January 2014) is to speak. As head of the Fed, which controls short term interest rates, he has more influence over the U.S. dollar’s value than any other person. Traders closely watch his speeches as they are often used to drop hints regarding future monetary policy.
22:45 NZD Building Consents (MoM) 8.3%
Building Consents (also known as Building Permits) measures the change in the number of new building consents issued by the government. Building consents are a key indicator of demand in the housing market.
Government Bond Auctions (this week)
Mar 29 09:10 Italy BTP/CCTeu auction
Mar 29 17:00 US Auctions 7Y Notes
Originally posted here

