SPX: What Can It Do For An Encore?
October set a record for the biggest one-month rally in the history of the US stock market. The S&P500, the large-cap stock index (SPX) closed Friday at 2079.36, up 160 points and 8.3% from the September close. Never done that before.
So what happens next, another record-breaking rally or a retracement? Does it go up, down or sideways from here? Should you book the profits and run, or stick around hoping for more?
Nobody knows for sure, of course, but here are some of the considerations that go into making a decision about your – and the market’s – next move.
Technical analysis
The analysts at JP Morgan– who have a remarkable record of making the right calls this year – view the October rally, especially in the second half of the month, as the result of big-money investors responding to technical signals after the August crash.
They see mutual funds and hedge funds as the principal beneficiaries of the rally; retail investors, they believe, are only beginning to dive in now… late as always.
The problem is that the technical factors that drove the funds into stocks in a big way at the end of September have largely dissipated, and they are now holding outsized equity positions.
The fundies won’t be driving prices up much longer; instead they will be looking to pass the potato. Who’s next in line? Retail investors, who have a relatively limited impact on the market, or corporate buybacks, which are becoming more difficult in a time of falling earnings.
Either way, it spells consolidation, not expansion.
Political- economic factors
That means the Fed, which has become the de facto manager of the US equity market. The Federal Reserve’s pattern throughout 2015 has been quite clear: talk a lot about “normalizing” interest rates — when economic conditions permit, if ever – but duck every time the moment comes to actually do the deed.
This time may be different however. The Fed has a definite credibility problem; the market is starting to doubt their tough talk, so they may pass a token increase – probably 25 basis points – at the December meeting, just to demonstrate that they can.
And some working papers released by the Fed indicate a level of satisfaction with economic conditions; they may feel comfortable enough to finally bite the bullet.
That isn’t good news for the market. Every time it looks like the Fed is really going to do something this time for sure, the market tanks, not because of the economic impact, but because of fear that the endless support the Fed has provided since 2008 may not be endless after all. Trees don’t grow to the sky, and nothing lasts forever – even this Bull market.
What we see
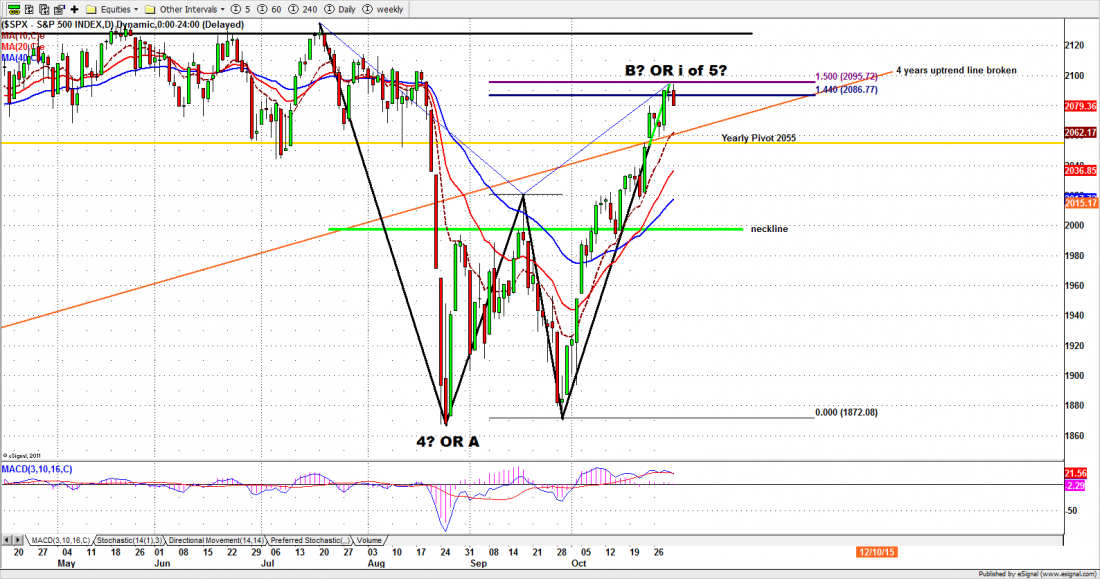
The SPX last week formed a doji pattern – a sign of indecision – right around the four-year up-trend that has supported the market since October 2011. That trendline was broken in the August crash, but regained last week, although the rally stopped at a key resistance level (See chart).
If the trendline holds, the SPX may take another run at the previous high. But there is formidable resistance overhead, the market is in an extremely overbought condition, and a bullish pattern we have been watching has reached all of the expected targets. This may be the tipping point.
2105-2096 will be major resistance zone and 2000-1980 (the neckline of the double bottom pattern) will be a major support. The index may drop to test the support in coming weeks, but it is unlikely to see the August low (1867) for the rest of the year. And we are entering into a very favourable season for stocks; any big drop could be bought by seasonal buyers.
This week begins with important news from China, which strengthened it currency, and continues with several Fed speakers during the week. In addition to company earnings reports, there is lots of US economic data to be released, especially the non-farm payroll numbers on Friday. We are expecting to see some surprises.
For detailed market analysis from Naturus.com, free of charge, follow this link
http://www.naturus.com/mailing-list-signup-page/
Chart: SPX daily chart, Oct. 30, 2015