
One of the more common questions we receive about “Gap Zones” is how the historical results compare among the various US indices.
The following table shows the historical gap fade win rates by opening zone for the S&P 500, Dow 30, Nasdaq 100, and Russell 2000 markets.
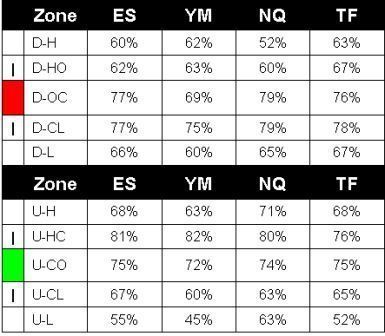
Note: The zones are based upon the standard nomenclature as defined on the Gap Zone Map at http://www.masterthegap.com/public/106.cfm
Key assumptions:
1. Enter in the opposite direction of the opening gap (i.e. fade) at the open of the New York Stock Exchange (9:30:00 am EST)
2. Target gap fill (prior day’s closing price: 4:15 pm EST for the futures markets)
3. Close the position at the end of the day (4:15 pm EST) if the gap has not filled. This is not a recommended strategy – always use stops!
The above results are based upon all “tradable” gaps with the following minimum size: ES: 1 pt, YM: 10 pts, NQ: 2.5 pts, TF: .5 pts, going back at least 7 years until 2002.

