
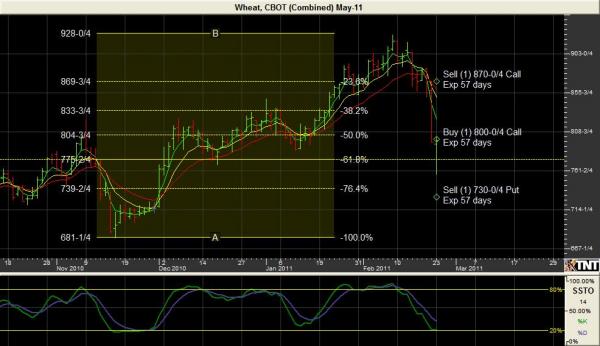
May Wheat appears to have fulfilled its Fibonacci corrective needs with dropping 618 percent of the upward move that started in November as well as showing us a huge “key reversal” bar in the process. So not only does it appear to be a “buy” technically, the fundamentals are bullish as well. Depending on the open, we will look to buy a 800/870 Bull Call Spread and sell a 730 put as a naked leg. According to a Fibonacci prediction, we could see Wheat run to 986 in the next few weeks. With that in mind there are several other strategies that you could employ so call us to see what works for you.
There is a substantial risk of loss in trading futures and options.
Past performance is not indicative of future results.
The information and data in this report were obtained from sources considered reliable. Their accuracy or completeness is not guaranteed and the giving of the same is not to be deemed as an offer or solicitation on our part with respect to the sale or purchase of any securities or commodities Any decision to purchase or sell as a result of the opinions expressed in this report will be the full responsibility of the person authorizing such transaction.
FOR CUSTOMERS TRADING OPTIONS, THESE FUTURES CHARTS ARE PRESENTED FOR INFORMATIONAL PURPOSES ONLY. THEY ARE INTENDED TO SHOW HOW INVESTING IN OPTIONS CAN DEPEND ON THE UNDERLYING FUTURES PRICES; SPECIFICALLY, WHETHER OR NOT AN OPTION PURCHASER IS BUYING AN IN-THE-MONEY, AT-THE-MONEY, OR OUT-OF-THE-MONEY OPTION. FURTHERMORE, THE PURCHASER WILL BE ABLE TO DETERMINE WHETHER OR NOT TO EXERCISE HIS RIGHT ON AN OPTION DEPENDING ON HOW THE OPTION’S STRIKE PRICE COMPARES TO THE UNDERLYING FUTURE’S PRICE. THE FUTURES CHARTS ARE NOT INTENDED TO IMPLY THAT OPTION PRICES MOVE IN TANDEM WITH FUTURES PRICES. IN FACT, OPTION PRICES MAY ONLY MOVE A FRACTION OF THE PRICE MOVE IN THE UNDERLYING FUTURES. IN SOME CASES, THE OPTION MAY NOT MOVE AT ALL OR EVEN MOVE IN THE OPPOSITE DIRECTION OF THE UNDERLYING FUTURES CONTRACT.

