

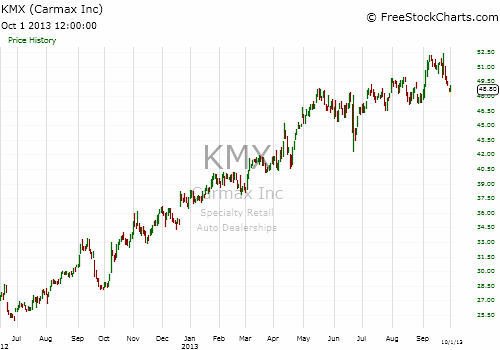
The sluggish economy has been good for CarMax. What used to be the “norm” of buying a new car — is now a luxury for many. For an asset that depreciates as soon as you drive it off the lot, many more Americans don’t see a value in buying new. That’s why KMX has seen a 240 percent increase over the past five years, compared with just a 40 percent increase in the S&P 500.
Think about that: while the S&P 500 has steadily marched higher, CarMax has shot higher – before virtually doubling again over the past year and a half.
CHART ACTION
Recently, CarMax has wavered within a $5 range, trading mostly between $47.25 and $52.47 over the past 30 days. The stock has been showing support around the psychological level of $47 and resistance in the $50 range. The stock is trading slightly below the 50-Day Moving Average ($49.54) and above the 200-Day Moving Average ($46.76). Despite a bearish MACD indicator, we believe the overall technical indicators give a positive view on KMX. One reason we discount the MACD in this instance is that it has tended to flash a bearish signal when KMX has traded near the 50-day SMA – something that has not prohibited the stock from gaining further.
EARNINGS GROWTH
To complement KMX’s short-term bullish technical indicators, the company is also having good earnings growth and solid fundamentals. KMX is currently trading below its intrinsic value of $57.79, suggesting that the stock is undervalued at these levels.
The trailing price-to-earnings ratio stands at 23.14, above both the industry average of 18.99 and the S&P 500 average of 18.32. The company is currently trading above the preferable P/E ratio of 15x, and over the last five years, the company’s shares have traded in the range of 11.93x to 66.46x trailing 12-month earnings. CarMax’s current price-to-sales is 0.93, also above the industry average of 0.58.
However, beneath these figures is a fundamental picture that deserves such high multiples. CarMax’s head-to-head comparison with its main competitors shows that the company have leveled gross margin, but much better operating margin. The company has the highest net income in comparison to its competitors, earnings per share are higher than the industry average, and the company has superior quarterly revenue growth.
KMX’s earnings per share over the last five years have experienced growth of 17.93 percent. The current quarter earnings in comparison to the same quarter last year have grown by 28.57 percent, which is above the threshold that our system looks for (15 percent). CarMax’s total debt-to-equity of 222.15 is high.
OPTIONS PLAY
Over the short-term, investors can consider a debit call spread to take advantage of these bullish indicators. Particularly, traders can trade November 2013 calls – buying the $49 call and selling the $50 call for a net debit of $0.45. With this well-defined risk/reward, the most traders can lose is the premium ($0.45), while the reward is capped at $0.55 – the difference between the two strike prices minus the premium paid.
= = =

