

Technical and fundamental indicators both show a bullish environment for MSFT.
TECHNICALS
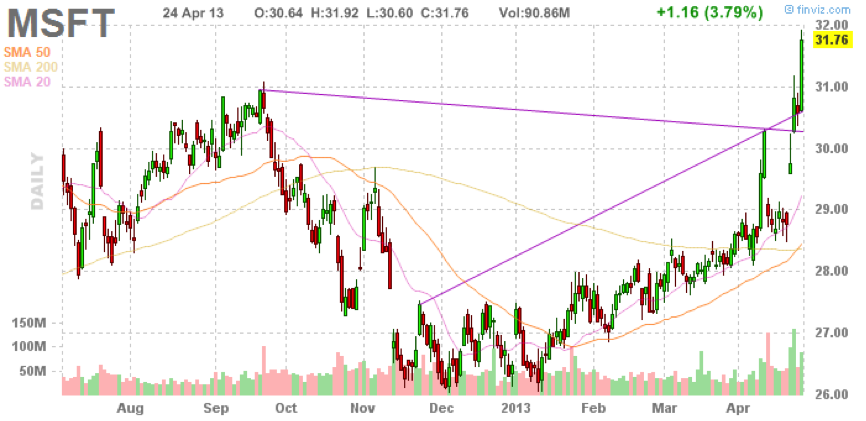
Microsoft (MSFT) has been trading in the range of $22.75 – $31.92 over the past 30 days and has formed a bullish MACD crossover signal, with support around $29.90 and resistance in the $32.00 range. The stock, trading above both the 50-day and 200-day moving averages, is at a 52-week high and has also broken overhead resistance at $31 on high volume.
FUNDAMENTALS
MSFT’s bullish technical indicators are also supported by strong fundamentals. MSFT reported net income of $6.1 billion for the fiscal third quarter, up 18 percent from the year before, and revenue was $20.5 billion, up 18 percent.
Other fundamental metrics are bullish as well: MSFT is trading 7% below intrinsic value, $34.32, suggesting it is undervalued. Its P/E ratio is 16.39, below the industry average of 40.20, and the S&P 500 average, 16.70. Further, MSFT’s current Price/Sales ratio of 3.49 is well below the industry average, 5.76.
OPTIONS STRATEGY RECOMMENDATION
Investors should consider the following debit call spread: Buy June 2013 32.00 Calls at $1.44 and sell June 2013 33.00 calls at $0.92. The net debit to start is $0.52, and we recommend holding until spread price reaches 1.20.
This strategy will allow you to collect time premium for the out of the money short call in order to decrease the overall cost of the trade.

