This week 1600-1596 will remain the key zone for GOLD. This key zone acts as a median line. If GOLD moves above it, the key zone will immediately act as support. If GOLD stays below that level the price could move back down to 1564-63.50 range or lower to 1556-46.50 range again.
Based on the daily chart, the short-term momentum indicators are in the neutral area while the intermediate-term indicators are giving mixed signals.
More troubling is that the long-term indicators are not very convincing about the rally. A long-term selling signal (50ema line crossing under 200ema line) was given on May 8, 2012, and GOLD has been trading below ir ever since.
We may see one more rally if GOLD can push up through 1610 level. But this rally shouldn’t exceed 1680.
On the downside, if the price breaks under 1523.50 line, it will be bearish and could trigger a broken descending triangle pattern movement.
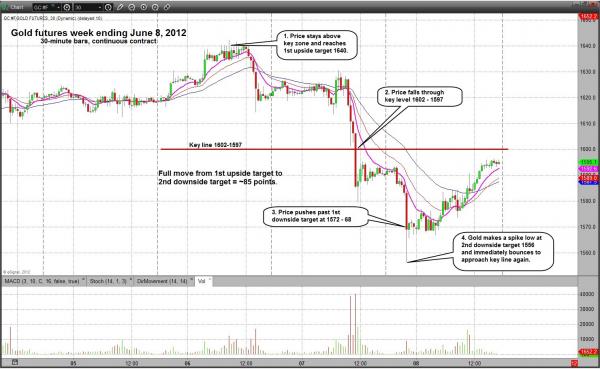
Here is the chart with Nat’s gold calls from last week. Click the chart to enlarge.
To see the full analysis of the gold futures market for the week of June 11, visit www.naturus.com/gold.