
On the surface, yesterday’s rally could be viewed as a positive reaction to Friday’s selloff, as the broad based averages closed up more than 1% across the board. With the Dow Jones Industrial Average up triples digits, the popular financial media outlets will have no problem reporting that the bulls are ready for another charge. For those of us who prefer to dig a little deeper, we noted few concerns with the action (we’ll get to them in a bit). Despite a positive open, the majority of stocks chopped around through the morning session before breaking out around 12:30 pm. The lunch time advance saw the major averages rally more than 1% off the lows of the day before stalling out around 2 pm. The last two hours of trading developed in to a tight-ranged chop, which allowed the averages to close near the highs of the day. The small-cap Russell 2000 led with a 2.3% gain. The S&P Midcap 400 Index rallied 1.6% with the Nasdaq Composite right behind at 1.5%. The S&P 500 and Dow Jones Industrial Average both finished up 1.3%.
One of the problems with yesterday’s rally was the overall light volume. Turnover sank on both exchanges with NYSE volume falling 23% off Friday’s pace, while Nasdaq volume came in 17% lighter. Friday’s big volume made it tough for Monday to come in higher, but the Nasdaq even failed to reach its 50-day moving average of volume. We continue to see a bearish volume pattern over the past few weeks, as heavy volume down days are followed by lighter volume up days.
Another concern we had with yesterday was the timing of the advance. The broad market averages stalled in both the morning and afternoon sessions, and were only able to rally during the lunchtime doldrums (as if the market tried to sneak in a rally quietly through the back door).
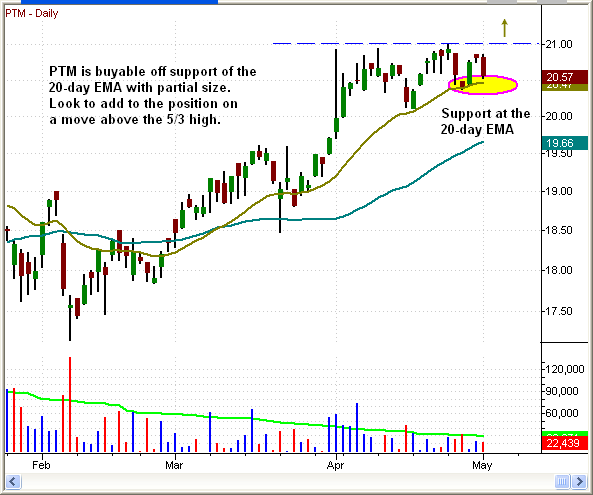
We are still monitoring the base-on-base price action in E-Tracs Platinum (PTM) for a breakout. The base-on-base pattern develops when a chart forms a productive base (from 4/1 to 5/3) on top of another base (from 12/3 to 4/1) with little separation in between. One could establish partial size if the price action pulls back to and holds the 20-day EMA, with the idea of adding more shares on a breakout above 21.00.
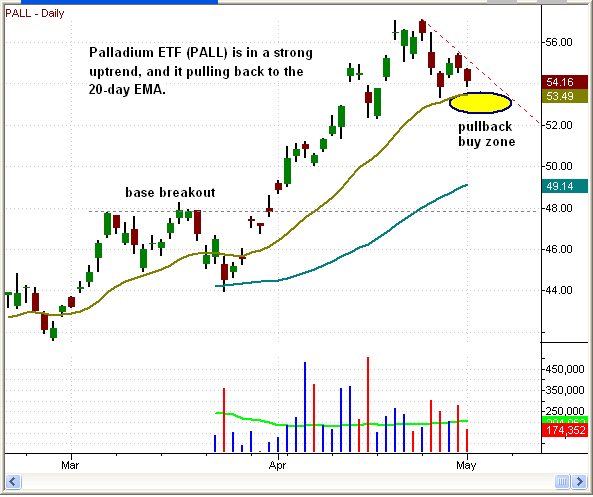
In sticking with the precious metals, we also see strength in Palladium ETF (PALL). PALL is pulling back for the first time since breaking out from a base in April. This is an obvious pullback to support of the rising 20-day EMA, so we could see some sort of shakeout below the moving average before the uptrend resumes. A strong buy entry may develop if a shakeout below the moving average is followed by a break of the short-term downtrend line (dashed red line).
Our scans have turned up a few warning signals on the weekly charts. SPDR S&P Retail (XRT) flashed a warning sign last week with a heavy volume, bearish engulfing candle on the chart below:
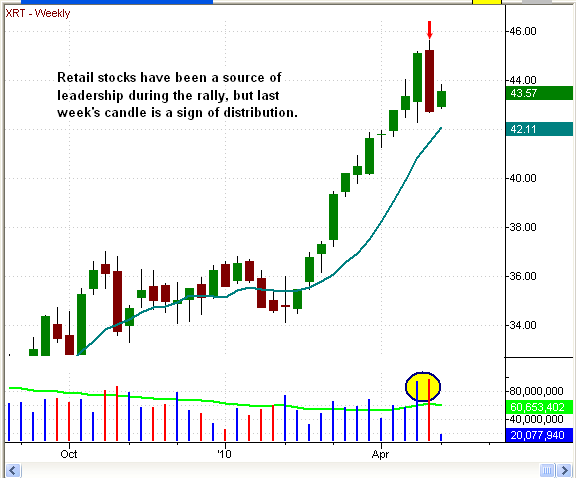
The bearish engulfing candle formed when the real body of last week’s candle consumed the real body of two week’s ago. A bearish engulfing candle says the bears have seized control of the market after an uptrend. Since both weeks are fairly large, the pattern is more significant. The higher volume also adds more power to the pattern.
Another bearish engulfing candle was found on the weekly chart of SPDR Insurance ETF (KIE):
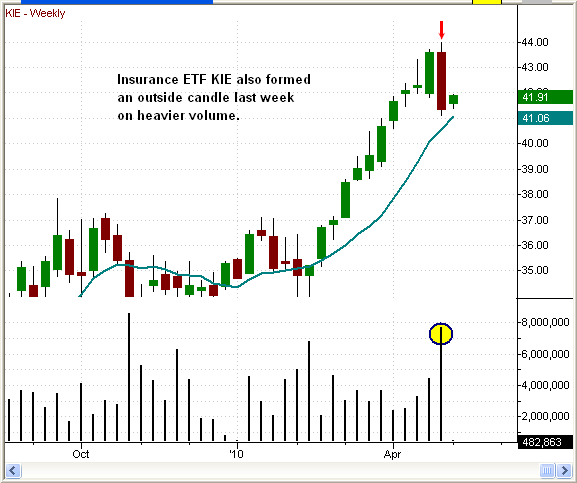
Once again we see last week’s ugly red bar consume the prior week’s real body on very heavy volume.
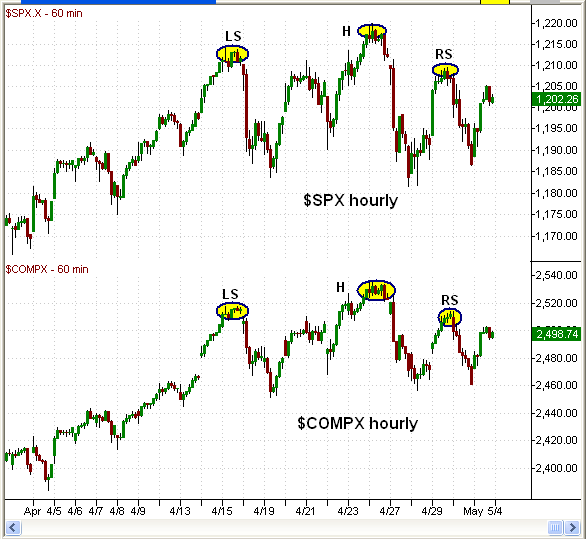
On the hourly charts of the major averages we are seeing a bearish head and shoulders pattern developing. The LS is the left shoulder, with the H (head) in the middle, and the RS (right shoulder). If the current wave up fails to climb above the right shoulder, then we could see this pattern follow through to the downside.
The bearish volume pattern in the market and distribution in leadership stocks will eventually take its toll. We remain fully in cash, which gives us the ability to quickly and easily take advantage of new opportunities as they develop, and without the risk of sitting through a choppy and volatile market.
| Open ETF positions:
Long – none |
 |
Deron Wagner is the Founder and Head Portfolio Manager of Morpheus Trading Group, a capital management and trader education firm launched in 2001. Wagner is the author of the best-selling book, Trading ETFs: Gaining An Edge With Technical Analysis (Bloomberg Press, August 2008), and also appears in the popular DVD video, Sector Trading Strategies (Marketplace Books, June 2002). He is also co-author of both The Long-Term Day Trader (Career Press, April 2000) and The After-Hours Trader (McGraw Hill, August 2000). Past television appearances include CNBC, ABC, and Yahoo! FinanceVision. Wagner is a frequent guest speaker at various trading and financial conferences around the world, and can be reached by sending e-mail to deron@morpheustrading.com.
DISCLAIMER: There is a risk for substantial losses trading securities and commodities. This material is for information purposes only and should not be construed as an offer or solicitation of an offer to buy or sell any securities. Morpheus Trading, LLC (hereinafter “The Company”) is not a licensed broker, broker-dealer, market maker, investment banker, investment advisor, analyst or underwriter. This discussion contains forward-looking statements that involve risks and uncertainties. A stock’s actual results could differ materially from descriptions given. The companies discussed in this report have not approved any statements made by The Company. Please consult a broker or financial planner before purchasing or selling any securities discussed in The Wagner Daily (hereinafter “The Newsletter”). The Company has not been compensated by any of the companies listed herein, or by their affiliates, agents, officers or employees for the preparation and distribution of any materials in The Newsletter. The Company and/or its affiliates, officers, directors and employees may or may not buy, sell or have positions in the securities discussed in The Newsletter and may profit in the event the shares of the companies discussed in The Newsletter rise or fall in value. Past performance never guarantees future results.
Charts created by TradeStation (tradestation.com).
© 2002-2010 Morpheus Trading, LLC
Reproduction without permission is strictly prohibited.

