
By: Zev Spiro

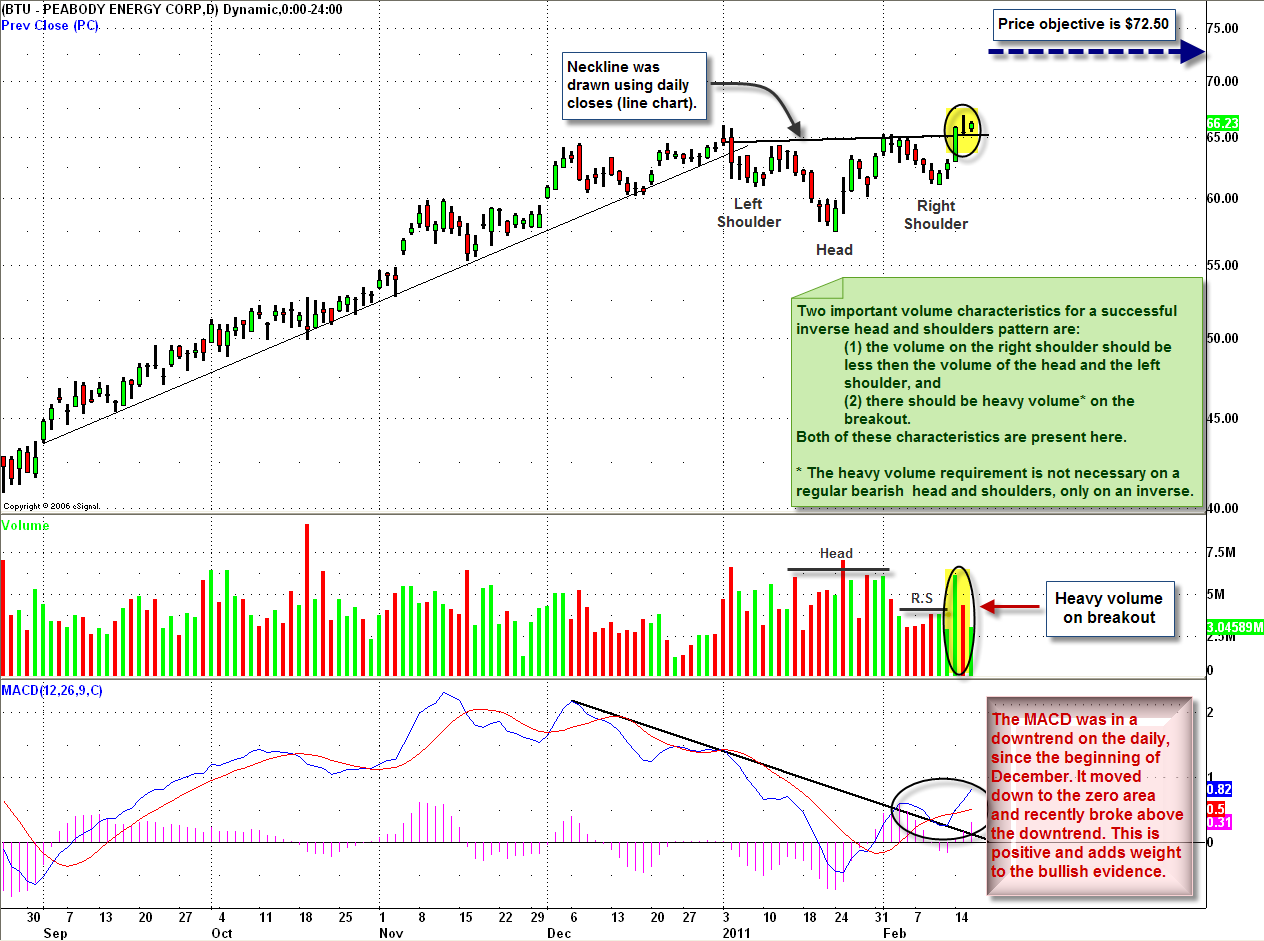
Recently, a bullish inverse continuation head and shoulders pattern triggered and confirmed in Peabody Energy Corp. (BTU). The minimum expected price objective is $72.50, obtained by measuring the height of the pattern and expanding higher by that same distance, from the trigger. The daily chart below outlines the price pattern, demonstrates important volume characteristics that are present and illustrates how the MACD indicator adds weight to the bullish evidence.
Target: $72.50, Protective Stop: Confirmed move below the neckline, Trail stop: Confirmed move below the minor trendline, which can be drawn by connecting the lows of the head to the lows of the right shoulder and extending.
UPDATES:
JP Morgan Chase & Co. (JPM): (Market Letter 12/22/10) – yesterday it achieved the $48 price objective, which was indicated. If one would like to hold for more potential gains, implement a tight trail stop strategy.
If you are interested in receiving Zev Spiro’s market letter, please email zevspiro@oripsllc.com subject “T3”
*DISCLOSURE: Long BTU, SPY
This material is being provided to you for educational purposes only. No information presented constitutes a recommendation by T3 LIVE or its affiliates to buy, sell or hold any security, financial product or instrument discussed therein or to engage in any specific investment strategy. The content neither is, nor should be construed as, an offer, or a solicitation of an offer, to buy, sell, or hold any securities. You are fully responsible for any investment decisions you make. Such decisions should be based solely on your evaluation of your financial circumstances, investment objectives, risk tolerance and liquidity needs. Visit the T3Live Homepage, Virtual Trading Floor, and Learn More About Us.

