

Historically September is the weakest months for stocks, and for 2013 August wasn’t great either – off nearly 4.5%.
BIG PICTURE
Each day I look at hundreds of charts of different stocks, indices, indicators, and timeframes to get a feel for what our firm should be invested in and where the risk is greatest within the global market. The percentage of stocks above their moving average can be a great tool in looking for confirmation of a move within equities as well as mean reversion with the market as a whole.
KEY TOOLS
Most often traders look at the percentage of NYSE stocks above their 50-day, 150-day, and 200-day moving averages. While the NYSE is helpful, I often look at multiple markets to see where weakness is greatest.
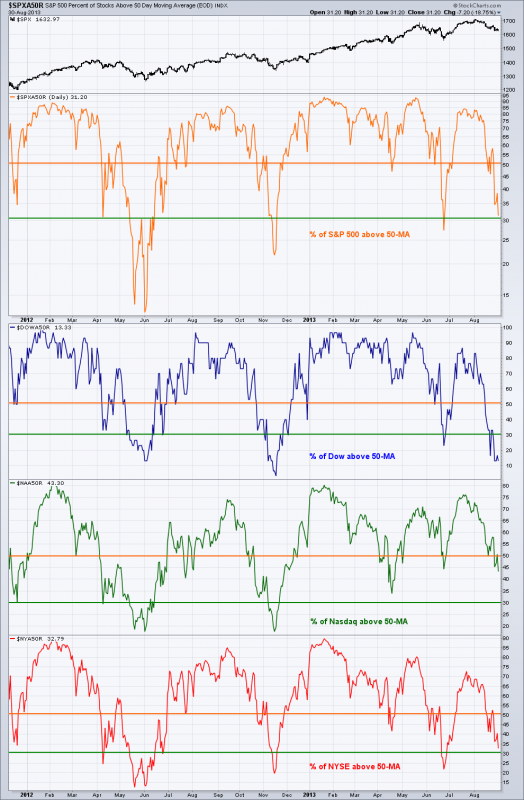
The chart below shows the percentage of stocks above their 50-day moving average for the S&P 500, Dow Jones, Nasdaq, and the NYSE. By looking at four different indices we are able to monitor selling (and buying) across the board.
DIVERGENCES
The percentage above a moving average can be helpful for a couple of reasons. First we can look for divergences. On the top panel of the chart I have the S&P 500. In May and June price dropped but saw the S&P hit a new high as the index recovered in July. On its face this is a great thing, we always like to see new highs —but we want to check the market internals for confirmation.
KEY QUESTION
Did the percentage of stocks above their 50-MA also confirm the breakout or at least hit elevated levels? Not really. We saw a divergence out of the S&P 500 stocks, Dow stocks, and NYSE, leaving just the Nasdaq as the only index to confirm. In fact as things broke down in August for the S&P 500, we saw a relative outperformance in the Nasdaq.
The second way I’ll use the percentage of stocks above a moving average is when the indicator for the indices breaks below a certain level, I often watch for a break of 30%. This would mean that less than 30% of stocks are above their 50-day moving average. However, we would need to take this into context of the overall long-term trend of the market. During the bear market in 2008 and early 2009 you can probably image that very few if any stocks were above their 50-day moving averages.
So first we must confirm that we are still in a rising trend and that the bout of weakness being seen within equities is a short-term correction and not occurring during a larger down trend. You can see earlier this year during the weakness in May/June we saw three of the indices have their percentage above the 50-MA drop below 30% before reverting back and taking prices higher.
MONITOR MARKET HEALTH
The percentage above a moving average indicator can be a great tool to monitor the ‘health’ of a market and see in greater context how stocks are performing as a whole. However it’s important to remember to use other forms of analysis when making trade decisions and that no single tool is the Holy Grail to fame and fortune.
Disclaimer: The information contained in this article should not be construed as investment advice, research, or an offer to buy or sell securities. Everything written here is meant for educational and entertainment purposes only. I or my affiliates may hold positions in securities mentioned.

