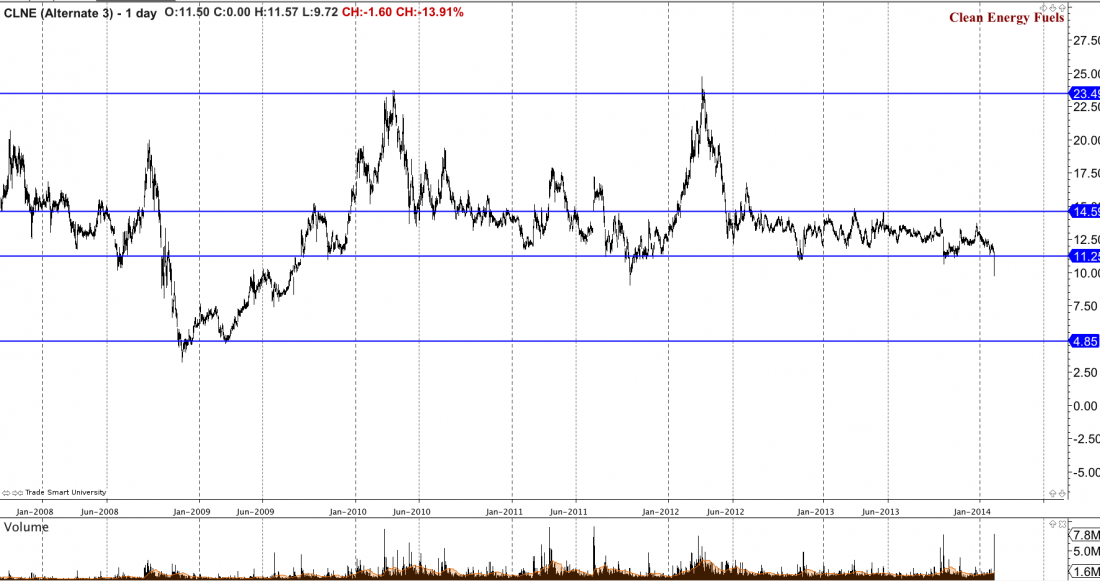
I usually only talk about long trades and/or bullish trades, but the more I day trade stock, the more I love shorting stock as well. Clean Energy Fuels Corp. (CLNE) looks like a great opportunity.
This is CLNE on a daily chart. It’s been in a sideways, trading range, channel up thing for years now. The $11.25 area has been a rock solid support for quite some time. As you may have noticed, it hasn’t broken this support in a LONG time, especially with this much “gusto” a.k.a. volume coming in. 7.8 million shares of CLNE were traded on 2/5/14.

CLNE also closed below the wick of the 10/9/13 candle. RSI is already very low for CLNE. On a daily chart, the RSI indicator is already at $16.30 (right around the value it starts to bottom out). This energy stock is below the 10, 20, 50 exponential moving averages, below the 100 and 200 simple moving averages on both the daily and weekly charts. If you look at a monthly chart, it’s the Mona Lisa of Bollinger band trades. CLNE has been failing the 20 simple moving average inside the Bollinger band since the middle of 2012, and for the first time in years, the stock has closed inside the bottom of the Bollinger band on the daily, weekly and monthly charts. Fact is, this stock has confirmed bearish and looks like a severely good shorting opportunity.
The first target is based off a long lower wick from 2011. $9.02 is the first target; then from there $7.40 and $4.85. Where would our stop and entry go? Well, this is the part that’s going to be a ‘smidge’ tricky because we do have to time it right. If we retrace at all on 2/6/14, the range of $10.40 and $10.82 would all be valuable shorting locations. The stop for sure, at this point, could simply go above the open of the 2/5/14 candle, so stop at $11.60. I’m fairly certain CLNE will have a small retracement candle of some kind on 2/6/14. If it continues the free fall, you can leg into the trade but waiting for a small retest would be glorious.
In a perfect scenario, CLNE forms a two to three day pennant pattern (with price action above $9.75) and we continue bearish from there.
Keep your eyes on this trade. It’s confirmed bearish for me, so create a trading plan and follow it because the edge on this trade is bearish!


