
Often, traders focus too much on price, and not enough on time. Time brings change. It’s time, or time cycles that cause short-term or long-term reversals or changes in trend. I want to emphasize how important it is for you as a trader to focus on time, and share techniques to improve your market timing. Planetary events–when planets change signs, turn retrograde or direct, or complete major planetary aspects/cycles to other planets– signal shifts in market trends that can give you a unique edge.
After more than a decade of study and research, I’ve discovered that it’s time cycles that cause trend changes in the market. You can study price charts and in retrospect, think you see a double-top or a retracement or some other pattern or price level that you conclude caused a reversal. In my opinion, that’s really not the case.
It’s really a time cycle, or planetary event, that causes the changes in trend. I believe that looking more closely at time, instead of price, will greatly improve your results as a trader or investor. When I refer to time, I am looking at it in terms of planetary cycles or planetary events. A planetary event is when a planet changes signs. The planets move at different speeds, based on their distance from the sun. When planets turn retrograde or direct, that marks a planetary event. When planets form aspects or angles to one another, these are planetary cycles. It’s these events that usually cause a change in trend and armed with this knowledge, you can make proactive trading decisions.
In my daily market reports, I list key reversal days and times for turning points during the week. I will briefly describe how these planetary cycles work and point out some key turning points for the next few months that I think are worth paying attention to.
Inner and Outer Planets and Cycles
Major changes in trend (longer-term) are usually associated with the outer planets: Saturn Uranus, Jupiter, Neptune and Pluto, and the nodes of the moon. Short-term changes in trend are usually associated with the inner planets: Mercury, Venus, the Sun and Mars. Aspects of the moon are associated with intraday timing.
The Moon. The moon spends 2 ½ days in a sign and has roughly a 30-day cycle. When the moon changes signs, it usually brings a short-term change in trend. The nodes of the moon have a cycle of about 19 years, and spend about 18-19 months in a sign. They are where the path of the sun intersects the path of the moon, and there is a north and south point. When they change signs, it very significant.
Following is a quick overview of the planetary cycles, and their speeds.
Mercury. Mercury has a retrograde about every three months for about three weeks, and it cycles about 20 days in a sign, depending on its speed.
Venus. Venus has a retrograde cycle every year and a half for about six weeks. It spends about 25 days in a sign. When it was last retrograde, it timed the bottom of the stock market in March 2009.
Sun. The sun spends about 30 days in a sign. It has an average daily motion of 59 minutes and 8 seconds.
Mars. Mars has a cycle of nearly two-years and spends about six weeks in a sign. It just went retrograde on December 21, 2009, in conjunction with a trend shift in gold and other commodities. We also saw a move higher in the stock market start at that time.
Jupiter. Jupiter has about a 12-year cycle and spends roughly a year in each sign. The weekend of January 15, Jupiter went into the sign of Pisces, which I think may be foretelling the start of a correction in the stock market.
Saturn. Saturn has nearly a 30-year cycle, and spends about 2 ½ years in a sign. When it turns retrograde or direct, it can coincide with key turning points in market trends.
Uranus. Uranus has an 84-year cycle and spends about seven years in a sign.
Neptune. Neptune has a165-year cycle. It changes signs very 14 years.
Pluto. Pluto has a cycle of 248 years, and spends a long time in a sign, 12 – 31 years. When it turns retrograde or direct, it’s very significant in terms of market reversals or turning points.
Let’s take a look at the daily chart of the S&P 500 and see how these cycles play out in the markets. Price bars for major planetary events or aspects and significant market tops and bottoms have been highlighted. First, look to the far left of the chart and see the spike lower on November 21, 2008. The market was crashing and the sky was falling, but most investors didn’t realize we were in a major planetary cycle. Jupiter and Saturn were forming a trine; a 120-degree aspect. That aspect only occurred three times in 2008. It’s very rare. The market’s decline coincided with what was the third and final time this trine was formed that year.
Fibonacci/Galatic Trader ™ 4.0 January 22, 2010 S&P 500 Cash
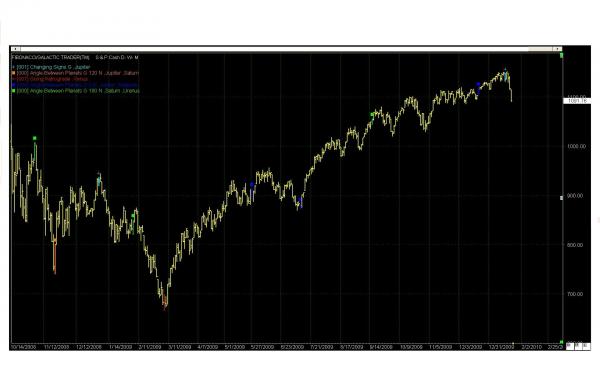
How do you actually trade based on this information? The entry technique is simple. You look for a key turning point reversal day or period. Give it two days to give a clear direction of a top or bottom before you enter a trade. You are looking for the high or low of the previous price bar to be taken out. For example, if the market is declining as it was on November 21, you wouldn’t enter the trade until the high of the trading prior day is taken out, and you’d enter on the long side. So, you are looking for a key reversal day, then an entry trigger or reversal bar. Prior to that low, we had a top on November 4, 2008. An outer planet cycle, Saturn and Uranus, were forming in opposition at that time, another rare event.
When price is trending higher into a key reversal day, you would look to sell. If price is trending lower, you would look to buy, using an entry technique. If price is not trending, you would look to buy or sell in anticipation of a breakout to coincide with a key planetary event. The Saturn-Uranus opposition timed the top in early November, and the Jupiter-Saturn trine timed the bottom in late November, until another major planetary event occurred.
On January 5, 2009, Jupiter changed signs, moving from Capricorn into Aquarius. The change in trend came two days after Jupiter went into Aquarius. As mentioned, it’s important not to enter a trade too soon; wait for confirmation on your chart.
The planets move at different speeds, but eclipses are also very significant. Solar and lunar eclipses are high energy periods that happen every six months. On March 6, 2009, another planetary event occurred; Venus changed signs and went retrograde. That happens only once every 18 months, and in early March, timed the low of the market for the year. You wouldn’t be buying on March 6 or the even the next day after the event; you would want to wait for the high of the previous bar to be taken out, then you would go long. Your stop-loss would be placed at the low on March 6, below the Venus retrograde bar.
Events for Early 2010
This year, on January 17, 2010, Jupiter changed signs and went into Pisces. When Jupiter changed to Aquarius last January, it marked a top and trend shift down. So the change in mid-January could mark the beginning of a correction. We got confirmation when the low on January 20 was taken out.
Going forward, on January 29, 2010, we’ll have a full moon and a major outer planetary cycle will occur. Saturn and Pluto will square each other on January 31, 2010. We could see some capitulation of a move higher or lower until the end of the month, which could present another good trading opportunity to buy or sell. Keep in mind, you can’t necessarily predict a top or bottom using these planetary techniques, just that it’s likely to be one or another if there is a trend established or a breakout if the market is in a trading range.
Should the market decline and continue correcting until month-end, I see a short-term bottom and another change in trend at this time. Should the market rebound and turn sharply higher the week of January 25, I would be anticipating another top, and another opportunity to short the market.
February 5 and 6 has another cluster of events occurring. Jupiter and Saturn are forming a 135-degree angle to each other, and Jupiter is going to sextile 60-degrees Pluto. It’s not important to get into the details of what that all means, just that these are key astrological events that would have implications for the market. February 12-13 is another significant period, when we’ll have a new moon. Jupiter is also crossing a multiple of 24 degrees, a W.D. Gann concept. So we have two potential reversal periods during the month of February.
In March 2010, the big event is when Mars turns direct. Mars went retrograde on December 21. When it goes direct on March 10, another big shift in trend is likely. On the March 19, the nodes of the moon cross a multiple of 24-degrees, another reversal point. The full moon and Jupiter point to another change in trend.
In April, we have two significant events. Pluto turns retrograde and Saturn retrogrades back into Virgo. These events are very significant. When you have two or three planetary events going on at the same time, it’s very important to note in terms of a big change. One possible shift comes on April 7, and another turn comes on the 14th. The big event in April is the third of five Saturn-Uranus oppositions. It’s a major cycle, symbolic of the financial crisis that materialized in 2008. It comes on April 26, close to the full moon on the 28th. Volatility should increase, and a change in trend seems likely.
These are just a few examples of planetary events in early 2010, so you can anticipate possible market shifts. This approach can work in any time frame you’d like to trade, whether you are a day trader, swing trader or position trader.
You can view a webinar on this topic by Ted, presented January 21, 2010, and see more charts and cycles. Visit the Events section and go to the archive area at lindwaldock.com.
Ted Phillips is a trader and President of Astro Advisory Services. He can be reached at 310-456-0530 or via email at starmanted@aol.com. For more information about his services, visit www.astroadvisor.com. Lind-Waldock clients can receive a special 20 discount when subscribing to his “Daily E-mini Astro Advisory Report.” Clients can go to the “Trading Advice” tab after logging into the Lind-Waldock.com web site to subscribe.
Past performance is not necessarily indicative of future trading results. Trading advice is based on information taken from trade and statistical services and other sources which Lind-Waldock believes are reliable. We do not guarantee that such information is accurate or complete and it should not be relied upon as such. Trading advice reflects our good faith judgment at a specific time and is subject to change without notice. There is no guarantee that the advice we give will result in profitable trades. All trading decisions will be made by the account holder.
Futures trading involves substantial risk of loss and is not suitable for all investors. © 2010 MF Global Holdings Ltd. All Rights Reserved.
Futures Brokers, Commodity Brokers and Online Futures Trading. 141 West Jackson Boulevard, Suite 1400-A, Chicago, IL 60604.

