

It’s probably time to start thinking about locking in a portion of our profits given the gains we have seen thus far this year in the S&P 500. Our near-term view is cautious and based on our behavioral models as well as certain other indicators; we think it makes sense for the market to pull back from here.
Part of our market analysis consists of using point and figure (P&F) patterns. We take this analysis one step further and track the percentage of companies in the S&P 500 that are in a bullish pattern.
CONTRARIAN CLUES
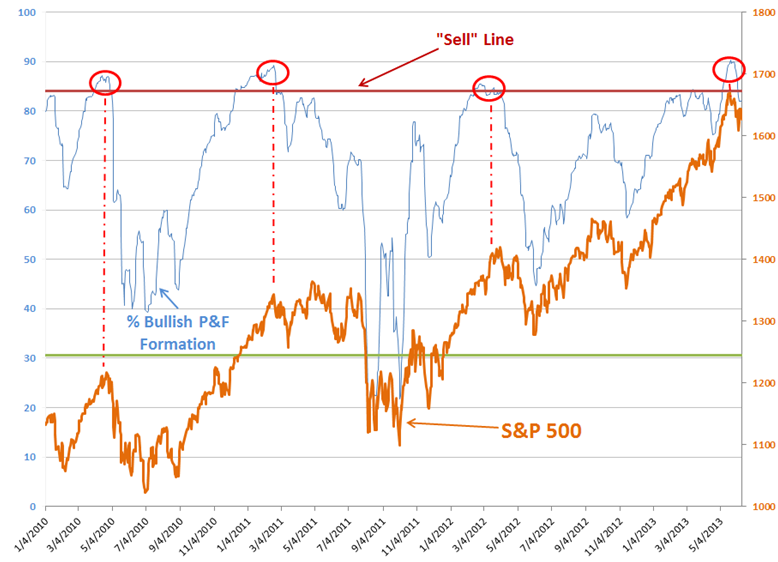
For instance, as of the start of June, 90.0% of the companies in the index (450 out of 500) were in bullish formation. The proper way to interpret this model is to view it as a contrarian indicator.
KEY LEVELS
Typically, when the percentage of bullish P&F patterns exceeds 84.1%, it usually signals a near-term pullback for the stock market.
When the percentage of companies in bullish P&F patterns falls below 30.5%, then it is a good time to enter the market.
Figure 1 below shows our tracking of this percentage and as one can see, we have reached the point where one needs to be extra cautious about the markets lofty run. While peaks in this model do not necessarily predict major downturns or corrections in the market, this model is very useful in determining near-term market softness.
BOTTOM LINE
With nearly 90.0% of the companies in the S&P 500 in bullish P&F patterns, near-term market weakness should be expected. Start adjusting the portfolio accordingly.

