

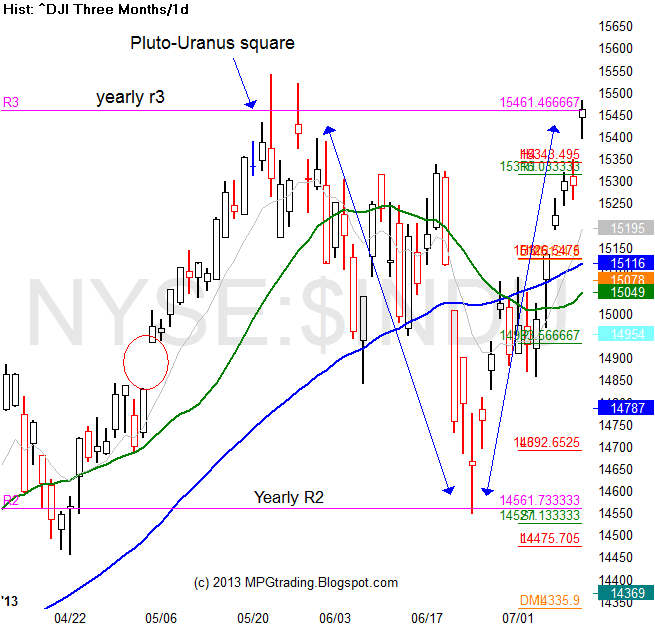
Since my first article in May, the Dow Jones index had a 6% pullback to the yearly R2 pivot (smart money covered their short positions and started buying long again) at 14,562. Since then a fast V-shaped rally back to the Yearly R3 pivot point. Why did the price keep reversing on these yearly pivots? Just a coincidence maybe? No!
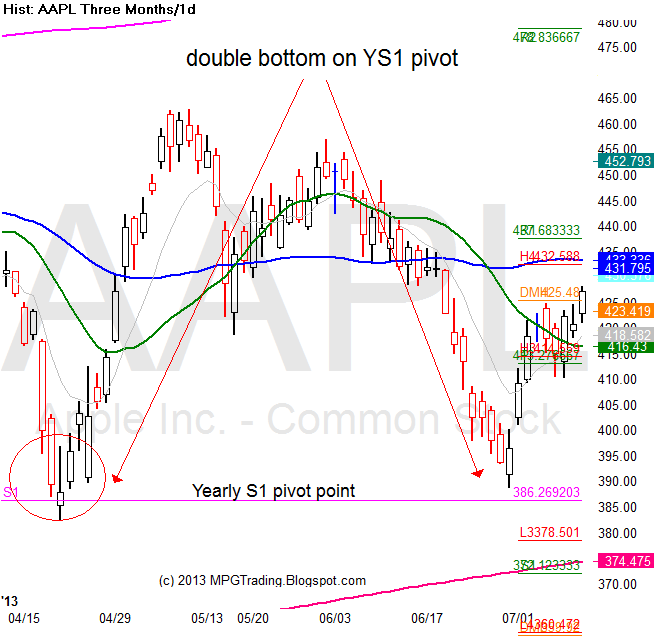
Apple did a double bottom bounce off its Yearly S1 pivot point and now could rally back up to the Yearly Pivot (P) at $550. Was this just another coincidence? No
If you know where the market makers and smart money is looking to buy and sell at, you have a big trading edge. Pivot points give me that edge.
WHERE DO WE GO FROM HERE?
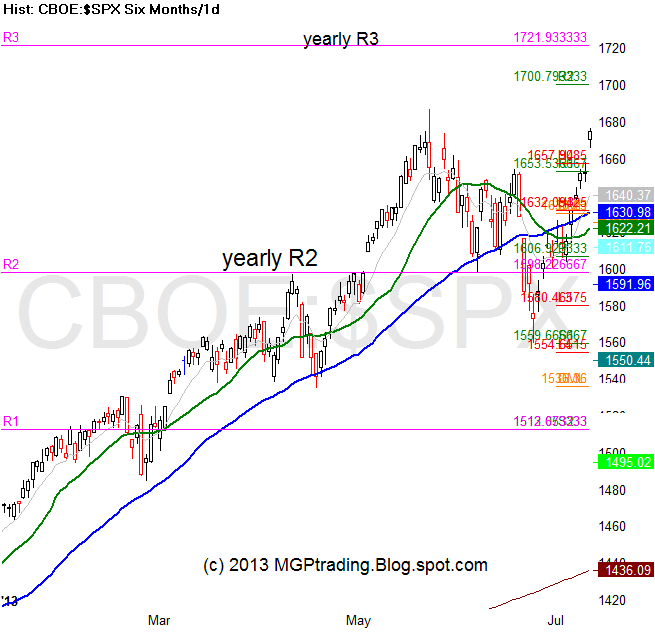
Could we fail again at this double top on the Dow, S&P and the NDX? Sure we could. But if don’t and we close above the Yearly R3 pivot on the Dow, that will open the door for the S&P’s Yearly R3 pivot at 1722. The NDX’s Yearly R2 pivot point is at 3186. The Dow’s Yearly R4 pivot point is at 16188.
HOW AM I TRADING THIS?
I’m a trader, not an investor at these price levels. My favorite instruments are the ES futures options (swing trades) and I day trade the Dow Jones futures (YM). Today I am flat at the Yearly R3 pivot. I booked my profits and now I am waiting for a signal to go short or long again (>15500).

