
Stocks rallied slightly higher on the open but lacked any buying interest and settled into a tight trading range through the morning session. An early afternoon breakout to new intraday highs failed to generate any momentum in the major averages, as they quickly slipped back into the day’s range. Overall it was an uneventful day of choppy trading, as stocks were content to do very little ahead of Monday evenings’s kick off to earnings season with Alcoa (AA) reporting after the close. The small-cap Russell 2000 held up best with a 0.3% gain. The S&P 500 and Nasdaq Composite both closed up 0.2%. The S&P Midcap 400 and Dow Jones Industrial Average just managed to close in positive territory, each up 0.1%.
Total volume was mixed. Nasdaq volume fell 26% off Friday’s pace while NYSE volume was slightly higher (less than 1%). Until we see a cluster of heavy volume distribution days in the market, we have to assume that the rally is in good shape and that any pullback is a buying opportunity.
Let’s dive right in with a with a potential pullback setup in the Health Care Select SPDR (XLV):

Since stalling out just below the January high in late March, XLV has pulled back in bullish fashion and formed a tight range of consolidation around the 20-day EMA. We like the fact that there are a few washout days to run stops below the 20-day EMA as well. The setup is buyable above Monday’s high, which would break the short-term downtrend line around 32.25. There is another potential downtrend line break (around the 32.50 area) created by connecting the high of 1/20 to the high of 3/22.
Semiconductor HOLDR (SMH) broke out to a new 52-week high yesterday:
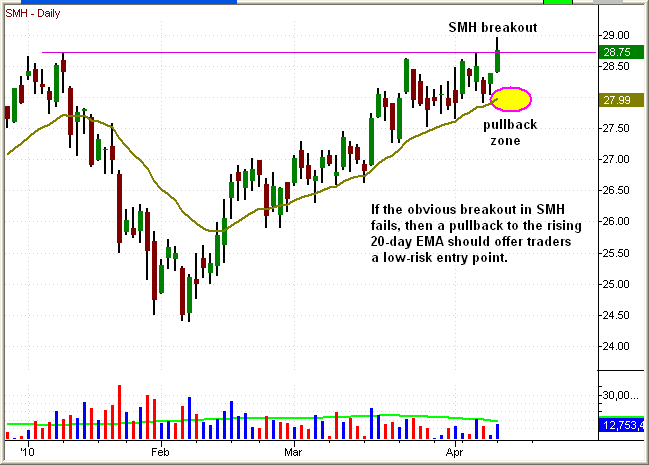
The breakout above the January high is quite obvious. Obvious trades tend to produce false breakouts, so if SMH does not hold up, then we could see a low-risk buy entry develop off the rising 20-day EMA.
With the recent strength in precious metals and energy, the PowerShares Commodity Index Fund (DBC) has come back to life and is now trading back above the 50-day and 200-day MA’s.

Monday’s false breakout from a tight bull flag pattern could lead to a short-term pullback to support. What used to be resistance from the February and March highs (around 24.00) will now become support. Look for a low-risk pullback entry to develop around the rising 20-day EMA within the next two to five days.
The weekly and monthly charts of long-term interest rates look to have bottomed out. While this is interesting to note, we are not long-term macro players, however; we still like interest rates to push higher in the short-term. We remain long TBT from our 3/26 entry.

The false breakout action in early April led to a pullback below the 20-day EMA. If Monday’s probe below support at 48.50 was just a one bar washout, then the price action should quickly reverse back above Monday’s high and the 20-day EMA within the next day or two.
| Open ETF positions:
Long – IAI |
 |
Deron Wagner is the Founder and Head Portfolio Manager of Morpheus Trading Group, a capital management and trader education firm launched in 2001. Wagner is the author of the best-selling book, Trading ETFs: Gaining An Edge With Technical Analysis (Bloomberg Press, August 2008), and also appears in the popular DVD video, Sector Trading Strategies (Marketplace Books, June 2002). He is also co-author of both The Long-Term Day Trader (Career Press, April 2000) and The After-Hours Trader (McGraw Hill, August 2000). Past television appearances include CNBC, ABC, and Yahoo! FinanceVision. Wagner is a frequent guest speaker at various trading and financial conferences around the world, and can be reached by sending e-mail to deron@morpheustrading.com.
DISCLAIMER: There is a risk for substantial losses trading securities and commodities. This material is for information purposes only and should not be construed as an offer or solicitation of an offer to buy or sell any securities. Morpheus Trading, LLC (hereinafter “The Company”) is not a licensed broker, broker-dealer, market maker, investment banker, investment advisor, analyst or underwriter. This discussion contains forward-looking statements that involve risks and uncertainties. A stock’s actual results could differ materially from descriptions given. The companies discussed in this report have not approved any statements made by The Company. Please consult a broker or financial planner before purchasing or selling any securities discussed in The Wagner Daily (hereinafter “The Newsletter”). The Company has not been compensated by any of the companies listed herein, or by their affiliates, agents, officers or employees for the preparation and distribution of any materials in The Newsletter. The Company and/or its affiliates, officers, directors and employees may or may not buy, sell or have positions in the securities discussed in The Newsletter and may profit in the event the shares of the companies discussed in The Newsletter rise or fall in value. Past performance never guarantees future results.
Charts created by TradeStation (tradestation.com).
© 2002-2010 Morpheus Trading, LLC
Reproduction without permission is strictly prohibited.

