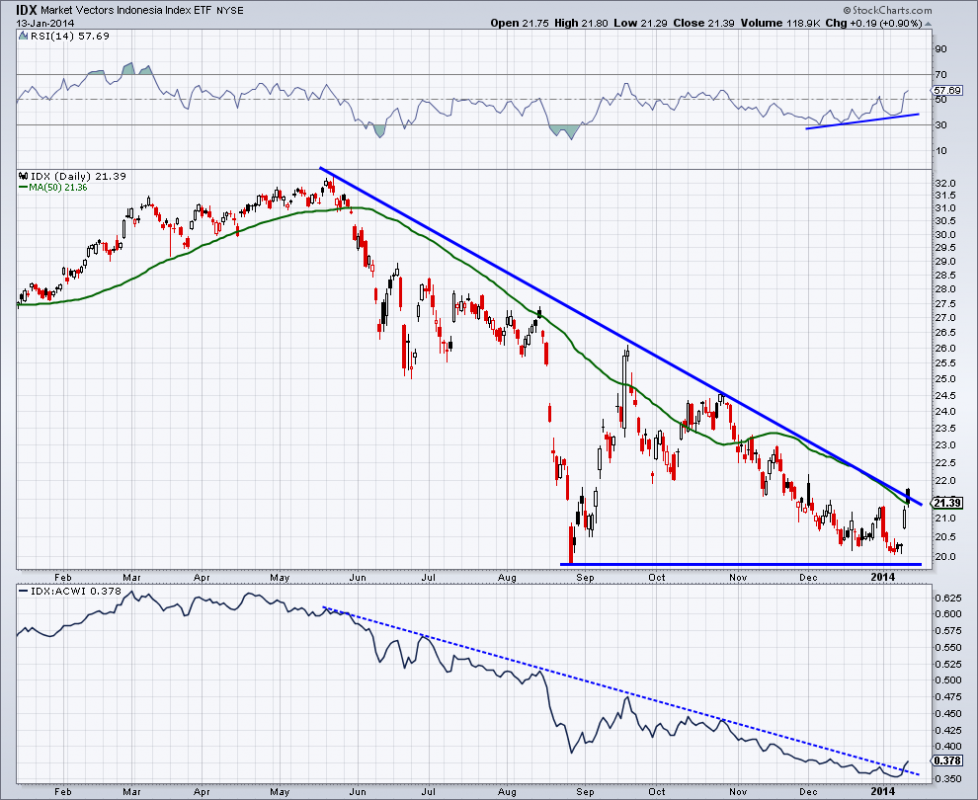
While domestic stocks had a great year in 2013, there were other parts of the globe that did not fare as well. Indonesia fell in this camp, with the Market Vectors Indonesia ETF (IDX) down 21% over the last twelve months. At the start of a new year we can begin to go dumpster diving and see what was trashed one year that may come back to have better performance the following year. This is the chart I want to discuss today.
Below we can see the price action of $IDX on a daily basis and that it’s been in a steep down trend since May of last year. We can see that the ETF is getting close to a double bottom as it nears $20 which was the low in August. While price has been heading lower momentum has been putting in higher lows. In the top panel of the chart we have the Relative Strength Index (RSI) which in December kissed the 30 level and has turned higher creating a positive divergence with price. This is a positive sign that maybe sellers may have begun losing their strength.

In the bottom panel of the chart we have the ratio of $IDX and the All Cap World Index ($ACWI). We can use this to see how Indonesia is performing relative to the global market. As the ratio heads lower it’s telling us that $IDX has been underperforming ACWI up until recently. The price action to start 2014 has been strong enough to break the down trend and begin to squeak out some relative gains to start the New Year.
Turning out focus back to price action we still must contend with the down trend off the May and October highs. On Monday we broke above this trend line during intraday trading but were unable to get a strong close with price finishing trading just above the 50-day moving average. What I’ll be watching for going forward is for $IDX to break and close above the falling trend line and begin to confirm the bullish movement taking place in momentum.
We also want to see Indonesia’s relative performance against the All Cap World Index to continue to rise as traders begin to show favor to $IDX. If the Indonesia ETF is unable to break its current trend then we may see a re-test of the August low with the potential for the down trend to continue.
Disclaimer: The information contained in this article should not be construed as investment advice, research, or an offer to buy or sell securities. Everything written here is meant for educational and entertainment purposes only. I or my affiliates may hold positions in securities mentioned.
= = =


