

In the trading world we live in, no other indicator is more reliable, faster, or more ‘predictive’ that candlestick patterns. Candles are like a painting. People can look at the same painting and feel or see different emotions but the picture itself is supposed to invoke a feeling.
Candles are a visual representation of how people feel, while trading a stock. One of my favorite bullish reversal patterns is the tweezer bottom. The tweezer bottom can be found on any time frame on any stock. (However, the higher priced the stock is, the more powerful it is). I discount any tweezer pattern on stocks less than $20 for my intraday trading. However, on the daily chart, unless the stock is less than $5.00, they are still quite rare. Another reason I like them
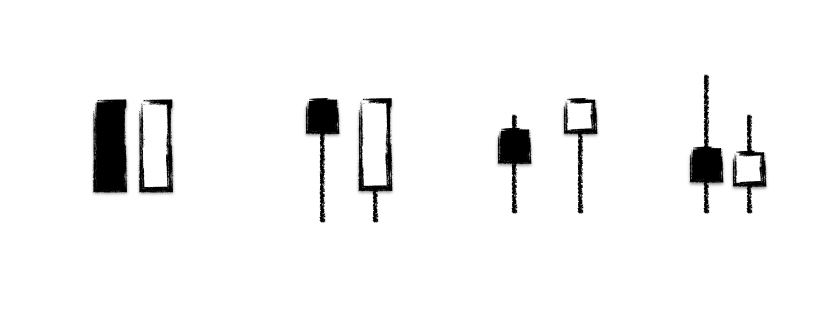
To form a true tweezer bottom, look for a bearish candle and a bullish candle in that order. The first candle must be bearish. The second candle must be bullish.
Then, to form a perfect tweezer bottom, the lows of both candles need to be identical. The lows can be wicks, or even stronger, the bodies of the candles.
The entry, is above the high of the first candle. The stop is below the low of both candles. From there, let the market do its thing! The reason it’s a bullish and strong reversal signal is because of the exactness of its nature. The bears are running and similar to a runner back who is stopped in his tracks on the goal line on 4th down, the very next candle matches the low and begins to run higher. I’ve created 4 images which are all tweezer bottoms. I’ve ranked them from strongest to weakest in my opinion. If you can find this trade on a daily chart, weekly or hourly at a support, it’s a very powerful candle pattern.
I hope this helps and trust this was enriching. If you want more information, feel free to download a free e-book I’ve created recently entitled “Everything You Need to Know About Candlesticks”

