

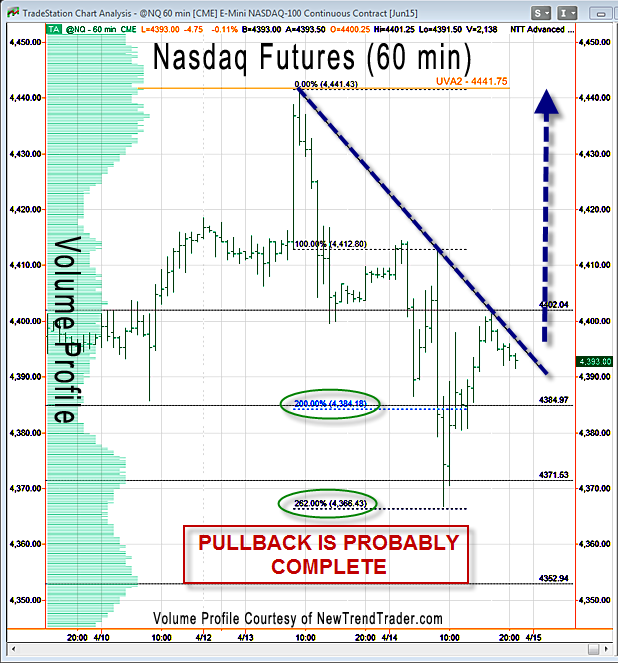
Markets move toward targets based on where previous transactions occurred. That’s the principle of Volume Profile that allows us to forecast target zones. The two levels identified on Monday as targets for Tuesday’s market were 4385 and 4366. These were Fibonacci extension levels that corresponded with a low volume node and a high volume node, respectively. The 4366 level marked the low of the day (4366.75).
While the advance off the bottom stalled at the 4402 level, the price pattern looks bullish. All that remains is for the downtrend line to be broken.
I assume the bulls are in complete control, since the major indices were up nicely today and the small caps were flat.
A Note on Volume Profile
The histogram on the left side of the chart shows the volume distribution in the Nasdaq futures for different periods of time. Key support and resistance levels are indicated by the peaks and troughs.
#####
If you would like to receive a primer from Kenneth Reid on using Volume Profile, please click here.

