

By: Zev Spiro
It was a very interesting day yesterday. World markets were spooked on Japan headlines and the major market indices had significant gap-downs at the opening bell. SPDR S&P 500 Trust (SPY) traded slightly below the $127 short term target obtained from the pennant formation highlighted recently. Bulls took control and a rally ensued for the remainder of the day filling the gap on a daily chart.
The iShares Russell 2000 Index Fund (IWM), PowerShares QQQ Trust (QQQQ) and SPY all recently ended their intermediate up trends, signaled by confirmed breaks below their 50-Day Moving Averages and intermediate up trend lines.
Only two trends remain, sideways and down. Many individual names have bearish distribution patterns forming and triggering, alluding to a similar scenario for the above mentioned indices. Below are potential bearish distribution scenarios for these indices, followed by a trade idea in MSCI Inc. (MSCI). These patterns are not fully developed and have not triggered (except QQQQ), therefore, they should only be used as a roadmap for a possible bearish scenario as the trend is subject to change at any time.
Chart 1: QQQQ: The daily chart below illustrates a bearish head and shoulders pattern that triggered with confirmation. This is the only chart of the three index ETF’s mentioned that has a fully developed chart pattern.
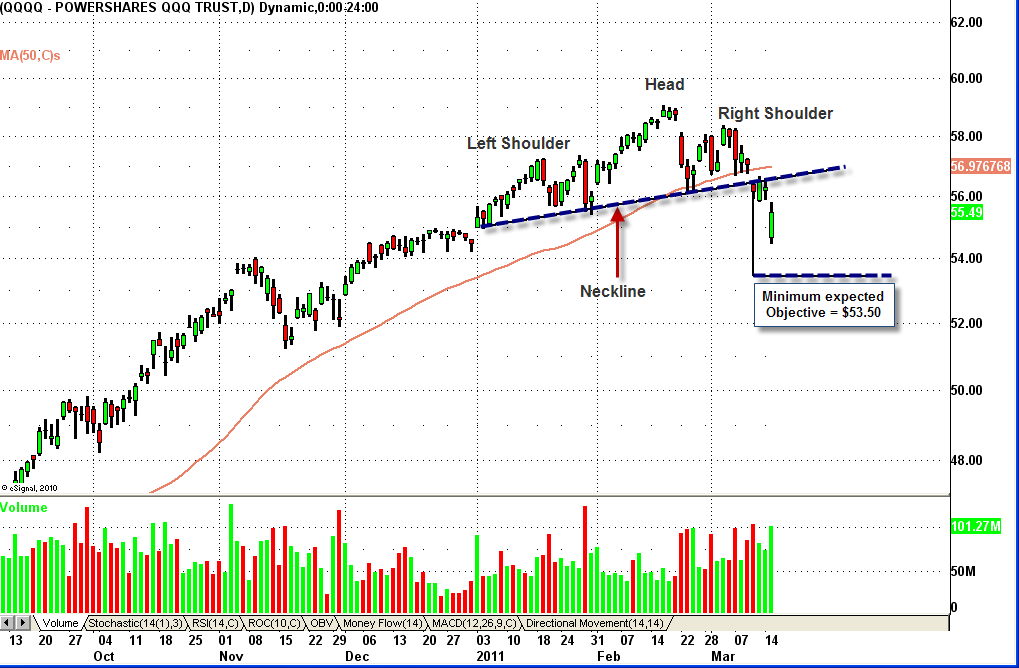
Chart 2: IWM: This daily chart illustrates a potential head and shoulders pattern that may form. It suggests a bounce in the near term that will then roll over. Resistance may be found at either, or all of, 1) minor downtrend line, 2) 50-day SMA, and 3) gap from March 10th.
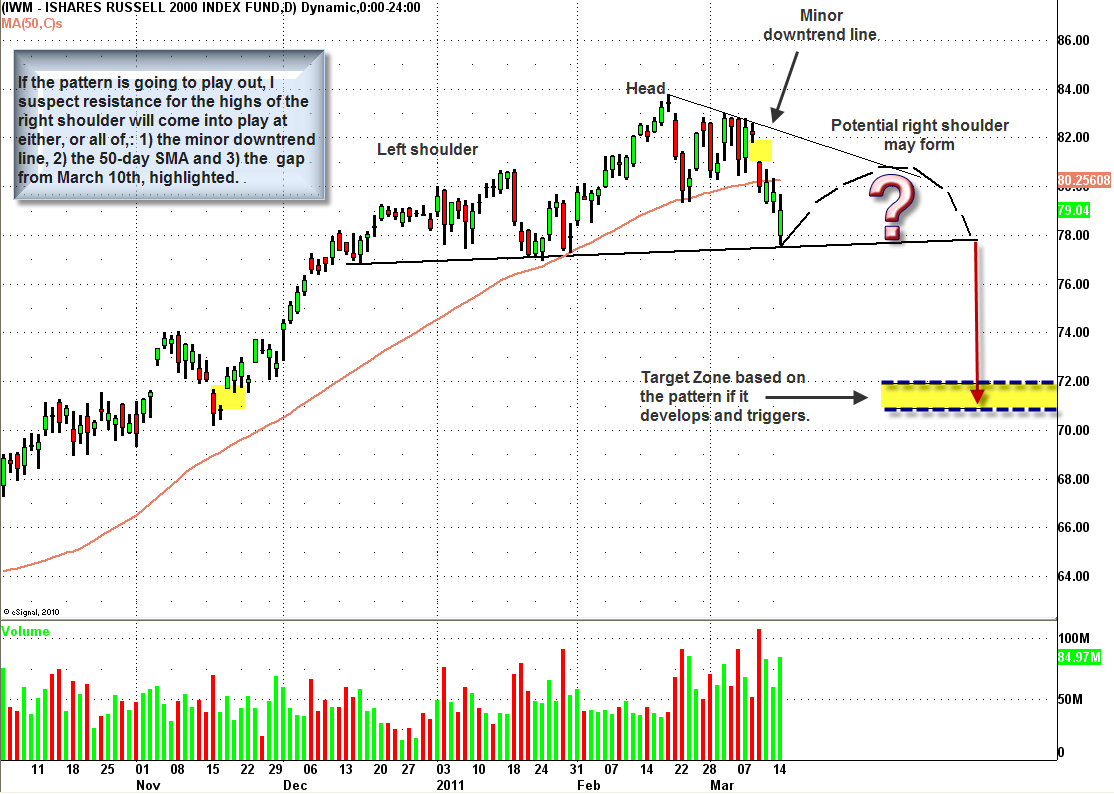
Chart 3: SPY: Outlined on the daily chart below is a potential head and shoulders distribution pattern, using daily closing prices. Same resistance areas as IWM apply here.
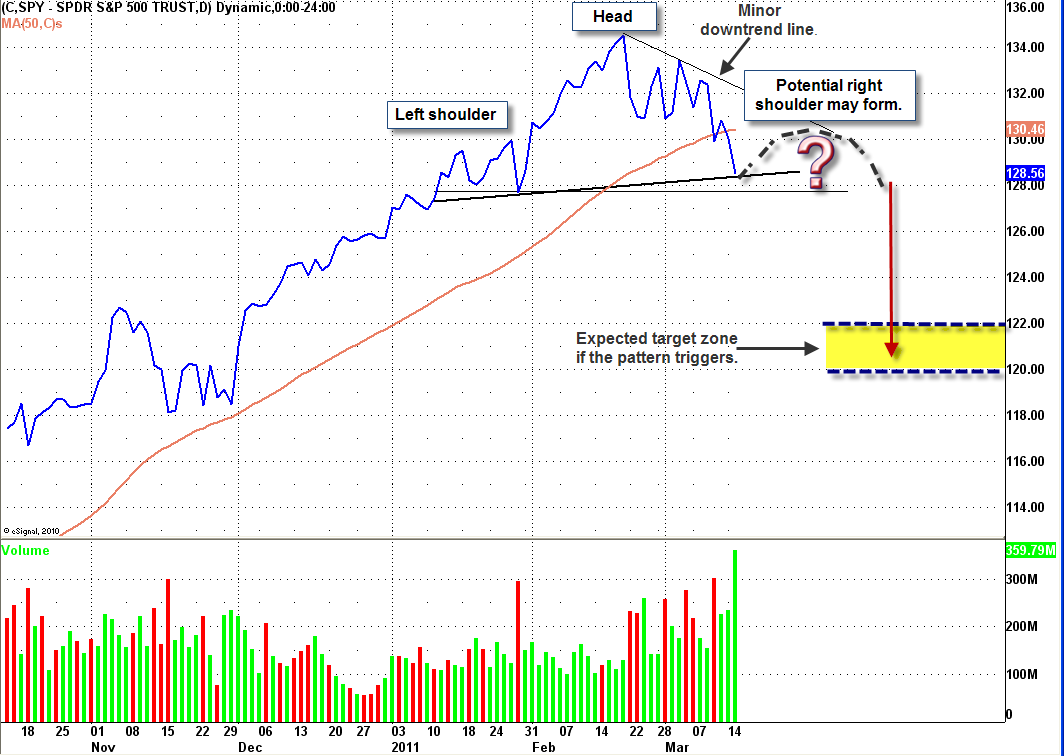
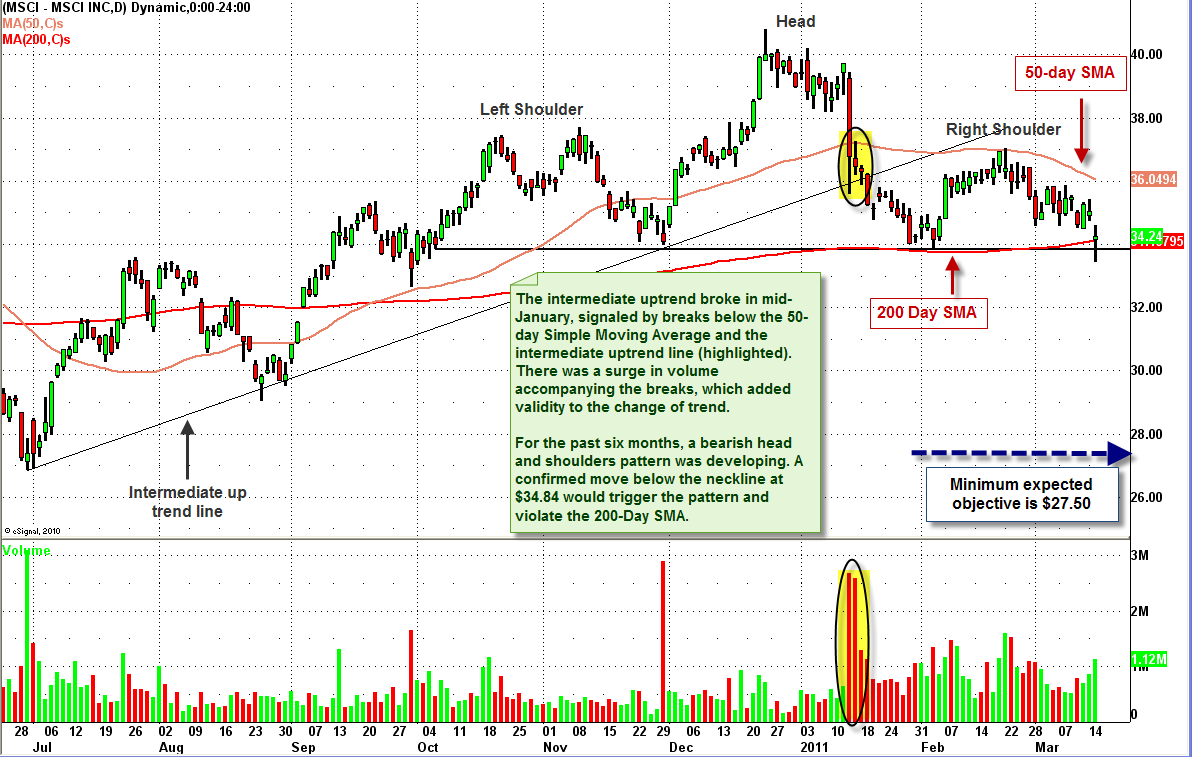
Chart 4: MSCI: The intermediate uptrend broke in mid-January, signaled by breaks below the 50-day Simple Moving Average and the intermediate uptrend line (highlighted). There was a surge in volume accompanying the breaks, which added validity to the change of trend. For the past six months, a bearish head and shoulders pattern was developing. A confirmed move below the neckline at $34.84 would trigger the pattern and violate the 200-Day SMA. Trigger: Confirmed move below neckline at $34.84, Target:minimum expected objective is $27.50. Protective Stop: confirmed move back above the neckline.
If you are interested in receiving Zev Spiro’s market letter, please email zevspiro@oripsllc.com subject “T3”
*DISCLOSURE: Short SPY
This material is being provided to you for educational purposes only. No information presented constitutes a recommendation by T3 LIVE or its affiliates to buy, sell or hold any security, financial product or instrument discussed therein or to engage in any specific investment strategy. The content neither is, nor should be construed as, an offer, or a solicitation of an offer, to buy, sell, or hold any securities. You are fully responsible for any investment decisions you make. Such decisions should be based solely on your evaluation of your financial circumstances, investment objectives, risk tolerance and liquidity needs. Visit the T3Live Homepage, Virtual Trading Floor, and Learn More About Us.

