When I first started day trading I used to trade the smaller time frames off the one and two minute charts but then I realized I was all over the place with entries and stops. I wanted to be in just one to three trades a day and have a higher winner average with solid gains. So I switched to the fifteen minute time frame and the stress left and account started to get some nice gains.
Stock Trade
LVS (Las Vegas Sands Corp) gapped down on September 2, 2014, below support at $65.89.
The fact that it gapped down under support gave me a bias of wanting to be short. I had LVS on a watch list and I was looking for a setup to find a short entry. One of my favorite entries to get short includes a stock that has gapped down and shows a fifteen minute failed buy setup.
How Does It Work?
I wait for longs to commit to a reversal trade. Then, I look for the failure of that move—so I can capitalize on it. I stick with the bearish bias and look for pattern traders to get trapped in a long position. When it fails for them it triggers me in short.
Chart Analysis
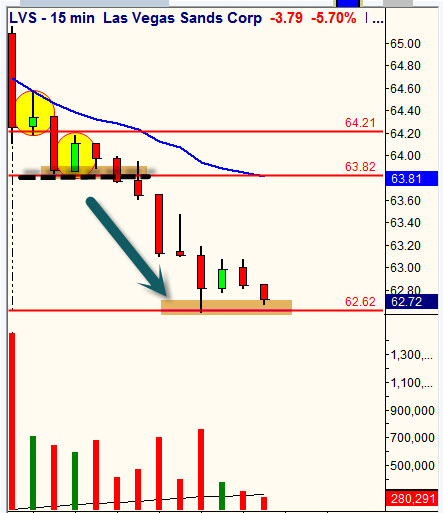
Watching the fifteen minute chart I look for a green bar to close in a downtrend. I look to get short at $63.82 under the previous green bar that just closed. I will place my stop just slightly over the fifteen minute green bar high at $64.21. Taking $64.21 minus $63.82 equals .39. The difference of the entry and stop is the risk amount and we share size according our risk amount. If you have a risk amount of $750.00 per trade you would share size 1,900 shares on this setup. If you were wrong and it stopped out, you would only be down $750.00. This trade ended up moving into lower prices making us a winner and if you trailed out at $62.65 you would have gained $1.17 which is three times your risk amount of .39 giving you a three R gain equaling $2,250.00 of profit. Not bad for just a simple day trade with managed risk and a clear setup.