
S&P500 Re-Cap 10-17-2011
The S&P 500 opened at 1214.50 (Friday’s Macro Resistance), 16.75 points above Friday’s settlement at 1197.75. The S&P traded .75 of a point higher before sellers stepped in and moved the market down to 1203.00 finding minor support and auctioning back up to 1209.
Sellers responded at 1209.00 and price moved downward in slow grinding pattern of lower lows and lower highs before finding support in K period at 1194.50. Responsive buying brought the market back up to the 1201.75 price level.
Resistance stepped in at the 1201.00 level and price traded down to 1193.50. Again support held and price traded between the 1193.50 and 1199.00 price ranges before closing at 1194.50
Support and Resistance Levels are after the Chart.
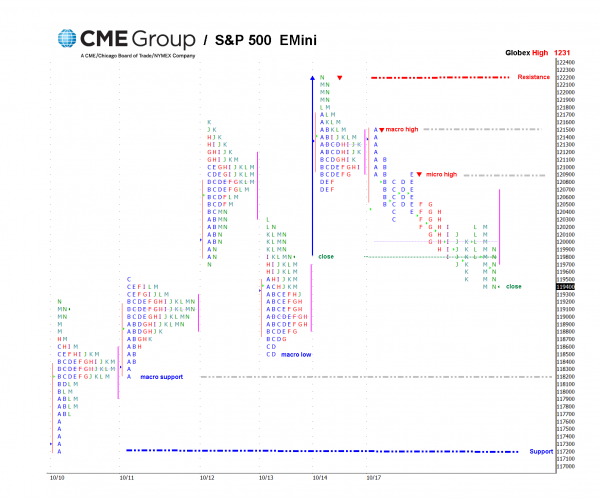
Macro Support
1185.25 10/13/11
1170.75 10/10/11
1144.75 10/6/11 and 10/07/11
1129 10/6/11
1109.25 10/5/11
Micro Support
1177.00 10/10/11
1153.00 10/7/11
Macro Resistance
1214.50 9/20/11, 9/16/11 and 10/17/2011
1229.00 9/1/11, 8/31/11
Micro Resistance
1201.00 10/17/2011
1207.00 9/20/11
1220.00 9/1/11
Take the FREE Market Profile course at www.ioamt.com

