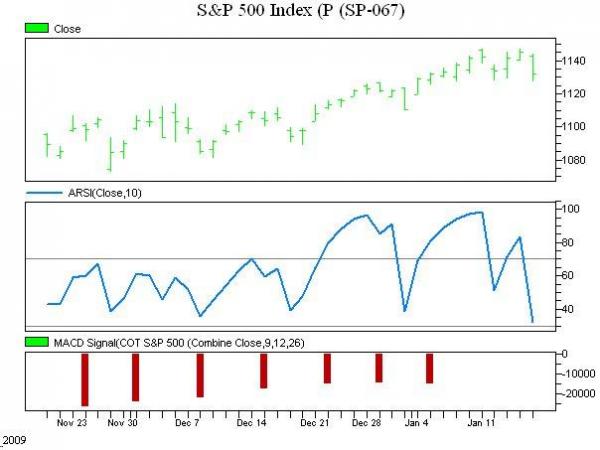
Just a reminder, these charts are posted as examples of the trades on the nightly COT Signals email. These trades will help illustrate the mechanics that go into creating the nightly email.
This morning’s example is a sell signal in the S&P 500.
First of all, we negative commercial momentum. Importantly, the degree of negative momentum actually increased over the last week – in spite of the market making new highs. This a classic commercial Index trading position. They tend to sell rallies and buy breaks. Especially when they feel their picture of the fundamentals don’t justify the market’s range extension.
Secondly, we three diverging tops on our daily ARSI indicator. The daily top in the S&P on Jan 11th was much higher than the high made on Dec 28th. Yet, the market only had enough energy to push the ARSI momentum indicator to the same Dec 28th level. Currently, the market’s push las Thursday, the 14th, barely pushed the indicator back into the overbought area.
These two pieces of market information paint a picture of a rally that’s running out of gas. We are selling March S&P 500 futures and risking them to the high 1147.
For those looking to hedge, one mini size contract at these levels represents approximately $56,750 in large cap equity holdings. This capital can be controlled with approximately 10% cash value in margin.
For more on hedging your equities, see my article http://www.traderplanet.com/articles/view/30779-hedging_your_equity_position_with_futures/


