

Equities have retreated from the April highs in the last two weeks, dropping 1.33% so far this week. The latest pullback brought the S&P 500 back down for the eighth test of the 100-day simple moving average since December. On Wednesday, the major U.S. equity index briefly went below the key moving average, but was able to rally 12 points off of the lows by the end of the session.
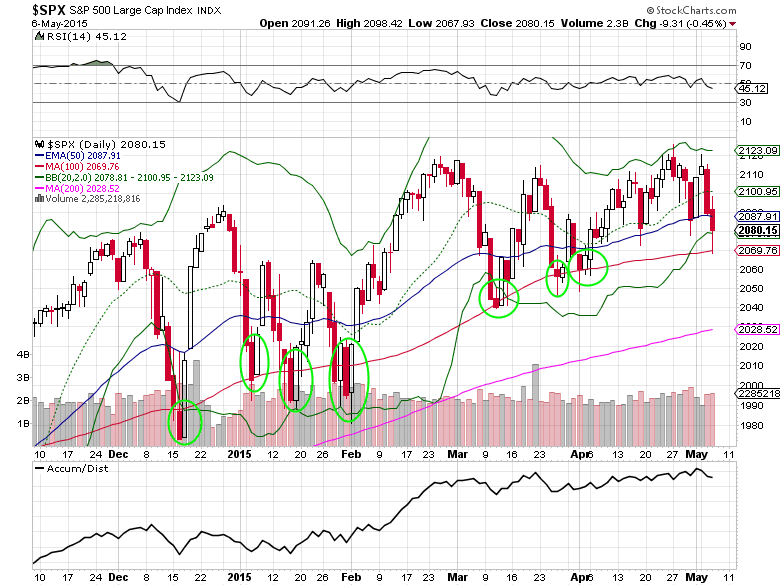
This type of price action could mean we are setting up for yet another successful bounce, providing for a low risk/reward trade for the bulls. In order for this to happen we’ll need to see a higher close, preferably above the 50-day exponential moving average (blue line on the chart). If this does in fact occur this week, consider taking a bullish position in the S&P 500 ETF (SPY) or S&P 500 futures, using a stop loss reference under the 2,067 level.
On the other hand, if a poor U.S. April jobs report or bearish news out of Europe drag down markets even further then you want to wait for a better entry point. A close below the 50-day SMA for a couple of days would be an indication that the S&P 500 will see additional downside risk to the lower 2,000’s (possibly the 200-day simple moving average at 2,028).
I personally believe the first scenario is the more likely because of what the NYSE McClellan Oscillator ($NYMOT) is telling us. Wednesday’s reading of -190 is the lowest since December and is basically at the -200 or lower reading I use to determine short-term bottoms in the overall market.
Either way the next few trading days shake out, watching these levels and indicators can help us make better trading decisions or avoid making the wrong ones.
###
To read Mitchell’s “Unusual Options Activity Report Featuring Bullish Put Selling In Zynga” at OptionsRiskManagement.com, please click here.
Related Reading:

