
The S&P 500 cash index (SPX) closed at 1071.69 on Friday, a decline of nearly 0.7% for the week, following on the heels of the previous week’s 3.8% slump. The SPX is now down about 4% for the year to date.
Early last week, SPX attempted to bounce back from the previous week’s slump, but Thursday’s disappointing numbers on weekly jobless claims, leading indicators and Philadelphia Fed manufacturing confirmed fears that the double dip recession is either on the way or here. SPX sold off. There was a small bounce on Friday — mainly due to option expiration manipulations — but that bounce is either over now or will end early this week.
Technical analysis
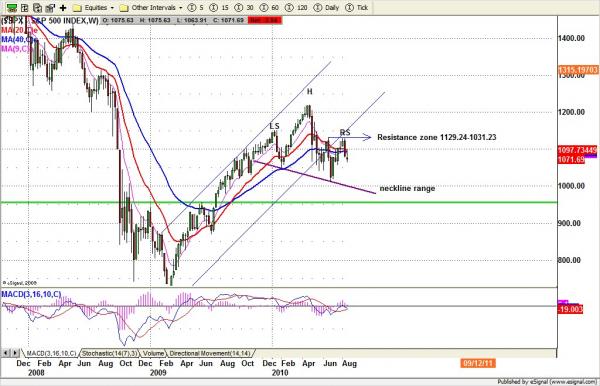
The SPX has formed a head-and-shoulders pattern and should approach the July 1-2 lows. The first target could well be the horizontal neckline of the weekly H&S pattern around 1050-1040 area, and the second target the actual neckline measurement around 1011-1000 range.
From Elliot wave theory, the price is in major declining wave 3, and this wave 3 should have a sizable decline. As long as the price doesn’t invalid last Friday’s high, the trend should be down and remain down until the final target area is hit.
Fundamentals
It is becoming clear that the economic recovery was an illusion. We saw some signs of recovery before April, and some economists believed — or at least said — the recession was coming to an end and economic recovery was on the way.
Recent reports demonstrate consumers didn’t spend their own money; instead they were spending the government’s money in the form of bonuses and rebates. As soon as those stimulus measures stopped, consumer confidence plunged again and retail sales slowed. Autos sales are back to recessionary levels. The fundamentals did not support the market’s early summer rally, which is now ending. No public official wants to talk about a double-dip recession, but it is now smart to prepare for one.
Monthly resistance 1150 and support 1000; Weekly resistance 1100 and support 1010
MONDAY OUTLOOK – S&P 500 MINI FUTURES (ESU0)
The S&P 500 mini futures contract (ES) has been in a broad consolidation range since mid-May. We saw a sharp dip in early July, and that dip could be the first indication that the current decline is likely to break through the major support line of the consolidation range around 1050-1048.
After an early bounce last week ES smoothed out an oversold condition and regenerated a selling signal on the daily chart. We may see a little further bounce from Friday’s movement Monday, but as long as price doesn’t exceed the 1098.50 area, the trend remains down. We should challenge the 1050.50-1047.50 range first. A break below 1046.50 will indicate July’s low 1006 will be next major target; in that case we will look to at least fill the July 7 gap around 1024.25.

