As a trader I’m always looking for an edge.
I’ve learned I cannot outsmart the market, so I look for clues on when and where the market should pull back and where to be a dip buyer. Over the past 18 years, I have learned many tricks that have kept me on the right side of the market. Some make sense, and some don’t. The two I respect the most are Pivot Point Analysis and the Bradley Model.
The last few weeks I’ve written a few articles for TraderPlanet: 1) the S&P is close to yearly pivot point resistance and 2) the Bradley Model is showing an explosive move. In the first article I talked about how the S&P 500 (SPY) usually gets a bigger pullbacks at yearly pivot points (Price). In the second article I talked about how I use the Bradley Model for when (Time) a trend may change, and it’s strength.
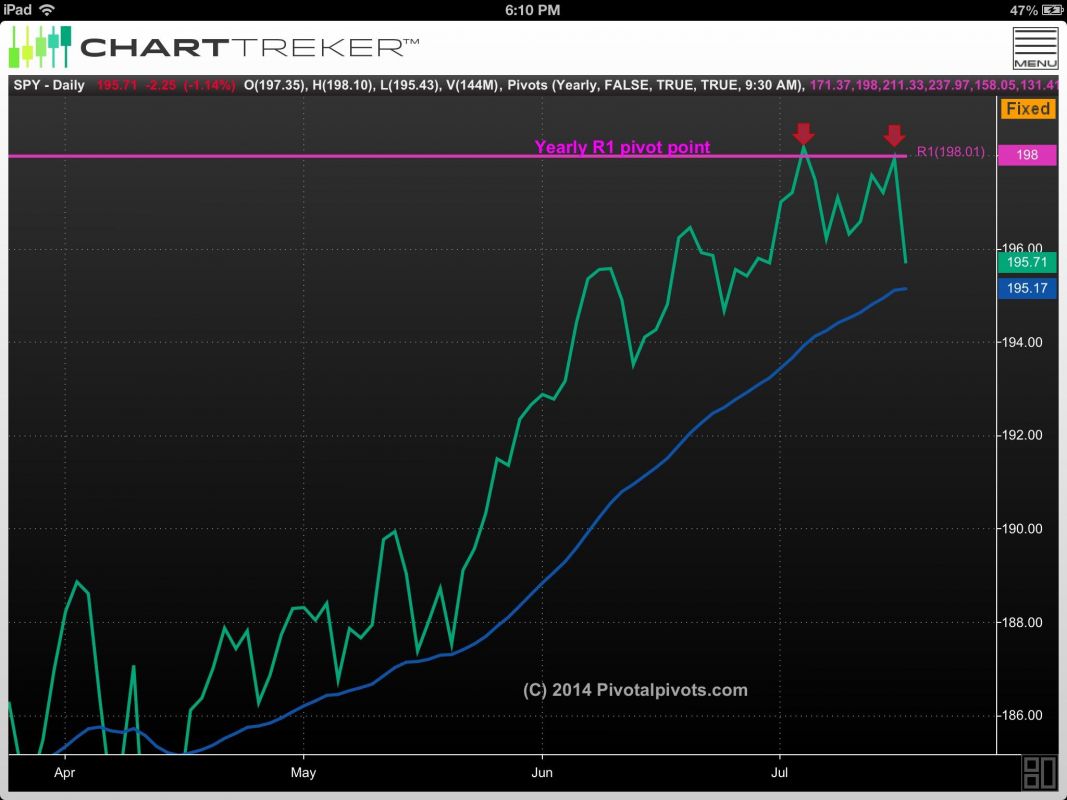
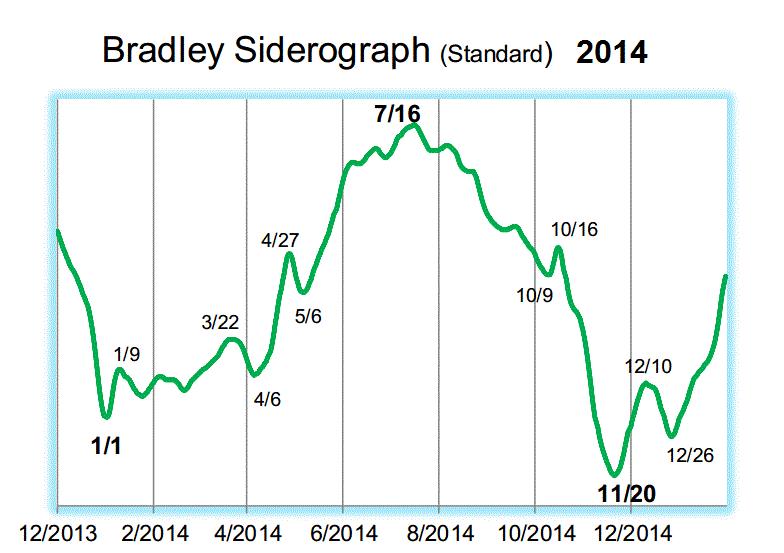
This past week both Price and Time converged. The S&P 500 (SPY) made a double top at the yearly R1 pivot point (see Figure 1), and it happened on the Bradley Model July 16 trend change date, per the Siderograph (see Figure 2).
What Does This Mean?
If past history is correct the S&P 500 (SPY) will now see a 3-10%+ correction that should last until early October, possibly into mid November of 2014. The $195 level on the SPY is the line in the sand.