

Last Friday, the S&P 500 (SPX) made another new all-time high and 1900 was the target by many bloggers and market technicians. A crazy thing happened on Friday —almost simultaneously I received three different e-mails from bloggers, laughing at any bears that are still trying to short this market.
Within one hour of the e-mails arriving, we saw the SPX go from +15 to -10. It ended the day +5 and these same bloggers were saying now that all the weak hands are gone, here comes 1900.
What’s the point of that story? It seemed as if many traders got bullish with the closing new high on the SPX right at the wrong time. These cycles will repeat over and over again and most will become bearish or bullish at the exact wrong time.
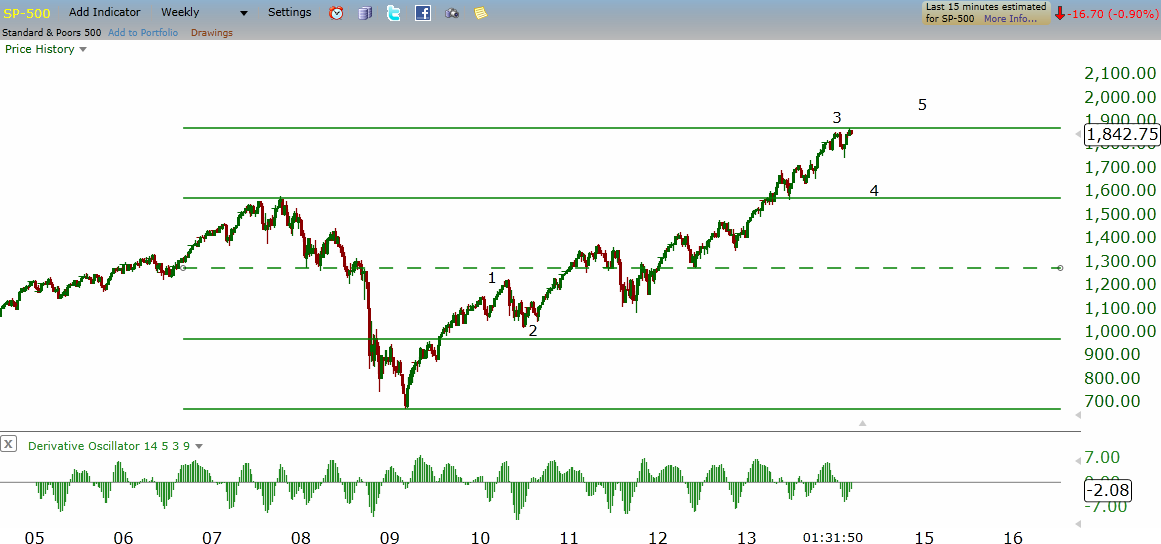
The turn lower came exactly on the day we were expecting (February 28) and now looking at a longer term wave count —we could see another 240 points lower, before this completes. And the wave count would still be bullish.
We have a good idea when this drop will end and one thing I can assure you-in a down market, you will be able to trade in both directions. As I mentioned, the longer term wave count is looking for another 240ish points lower on SPX, but there will be big upside bounces along the way.
If you want to trade the long side, simply follow a shorter term chart like the 60 minute, wait for the short term cycle to complete and go long. Just remember, until the longer term cycle completes, the trend will remain down.
= = =
See Dean’s free newsletter with the exact turn date here.

