Monday Evening 2 November 2009
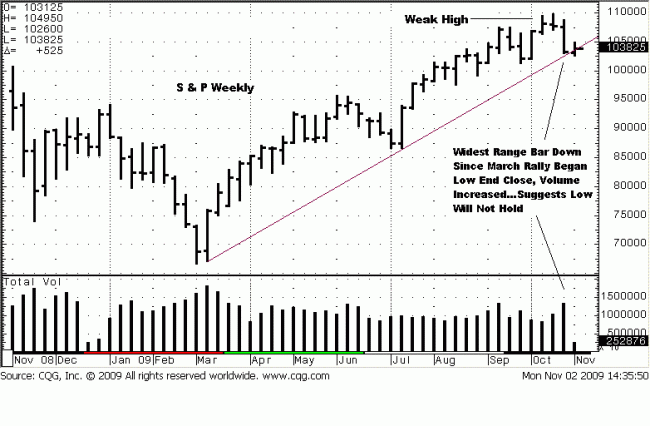
Price activity last week was the weakest since the March madness rally began,
both in terms of time and price. The range was the largest decline down, the
close was low end, and volume increased to the highest level in months, all
signs of sellers stepping in and taking control from the buyers. The stage was
set from the weak high, pointing to the small ranges of the previous two bars
from the end, and the second bar in particular. Price made a new high for the
rally, but the range was small. This one little bar is replete with a message
from the market.
We can see from it that buyers were spent, unable to extend the range higher.
The close was under the opening, and it was lower than the previous week’s
close. Plus, you can see that volume picked up, at the same time. The pickup
in volume tells us that sellers were stronger in activity than buyers, and this is
proven by the lower close. Sellers won the battle of the bar, but this specific
bar occurred at new highs where buyers are supposed to be in control. Market
activity told us otherwise. The stage was set from the second and third bars
that led to last week’s substantial sell-off.
A trendline has been drawn up from the March/July lows, and that is where
price held on the decline. Knolwedge of the trend is the most important piece
of market information you can have. The weekly trend is up, so price should
hold at expected support, and it did. BUT, the trend has been weakened for
reasons just described. The volume increase on a large price decline suggests
the trendline may soon give way.

The daily chart gives greater detail. Price closed under the trendline [Friday,
second bar from the end], the same line shown on the weekly chart. [Contract
changes since March accounts for the difference in where price closed on the
different time frames, one above, one below]. The intra day activity is not
shown here, but volume activity late on Friday was unusually high for the time
of day, and that in itself is a message not to be ignored. The increased volume
occurred as price came cascading down with impunity. Buyers were unable to
stop the onslaught. Here is where knowing the trend of the various time frames
is so important. We saw that volume as a potential mini-selling climax that
might stop the decline.
Why?
If the weekly trend is up, support should hold…and it did. It may be in the
tenth round and floundering on the ropes of support, but the trend is still up in
the larger time frame. That tells us not to press too hard on the smaller daily
time frame because it conflicts with a larger, controlling trend. Combine that
with the mini-selling climax, and a possible reflex rally may occur. There is
more that can be added to the mix.
On 1 October, there was also a relatively large sell-off. On the intra day chart,
[not shown] the last 60 min bar closed mid-range on increased volume. That
says there were buyers at the lows…as well there should be… Why? Because
at that point in time, the daily trend was up. Next day, 2 October, price gapped
open lower, but the first 60 min bar rallied and closed high end, [a show of
strength] and a trading range developed for the remainder of the day. There
was no more downside follow-through. Next trading day, Monday 5 October,
price opened unchanged and proceeded to rally above the little trading range
and did not look back for over 80 S&P points. Knowledge of the trend is vital!
Guess where Monday’s decline stopped? Right at the little trading range from
30 days earlier. The market showed support back then, and because of the
weekly trend and support trendline, it showed support once again, despite the
more negative daily activity.
The potential mini-selling climax was confirmed by Monday’s lower open and
rally to close near the high end for the day, AND above the large volume selling
from Friday’s close. There was little reward for all the selling effort after such a
steep decline. That observation calls for caution.
As an aside, the reason for calling for a change in the daily trend as no longer
being up can readily be seen in the volume activity for the first two weeks of
October. It went down as price went up. Volume being the energy behind a
move, there was very little energy! Contrast that with volume activity for the
second half of October as price declined. Volume increased. Sellers recognized
the weak top at the high, and they became more agressive in noting the
inability of buyers to retain control. The market messages are always there.
Sometimes they are not always obvious, but they are alawys there.
We drew a dotted horizontal line extending into the future to represent where
a retest rally may encounter resistance. It starts aroung the 1056 area and
extends to the 1062+. Where will price hold? We do not know for the future
has not yet happened, nor do we need to predict. We can draw some obvious
inferences from the gathered facts to see where price MIGHT stop on a rally.
We will know better as present tense market activity develops, and both price
ranges and volume will tell us if a rally is weak or not. The market always
advertises its message.
Because the daily trend is no longer up, and the intra day trends are down, no
long positions will be taken. [Rule: Never go against the trend in the time
frame you are trading]. Instead, we will wait for some indication to go short on
weakness.
The market never disappoints, if you are patient.


