Tuesday 20 October 2009
The market activity for the past several trading days has been showing signs
of weakness, certainly not for the first time since the July rally, but this time,
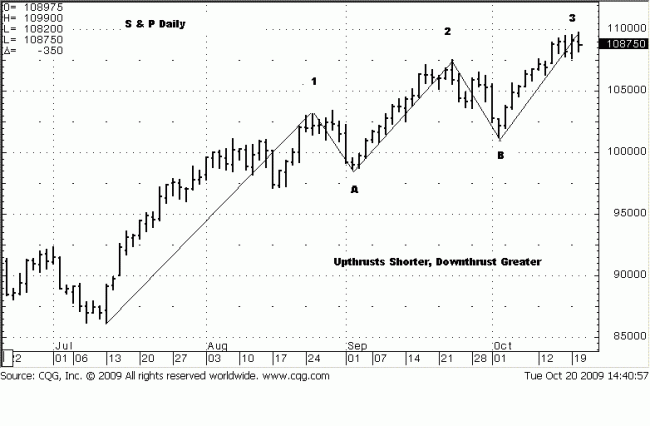
a correction of substance may set in. The daily chart shows the swing highs
and subsequent minor corrections. A visual inspection shows the July to
August rally longest in time and price gain, number 1 on the chart below.
The correction to A was small and brief.
The rally to swing high 2 was not as long in time or price. What is more
notable is the ensuing correction. It was deeper in price retracement to swing
low B, relative to A. The most recent swing high, 3, was the smallest in price gain. What this says is that the rally is weakening…not over, just not as
strong.

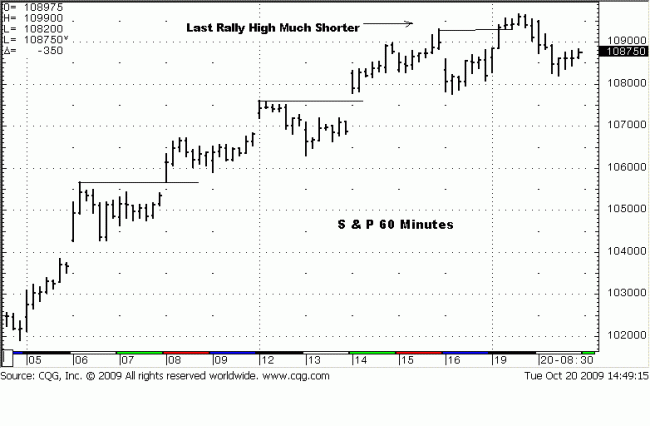
The second is an intra day 60 minute chart to show activity at the highs in
greater detail. Horizontal lines have been added to the swing highs, starting
on the right. The first two horizontal lines show how price stayed above the
respective swing highs. The third line at the top shows two pieces of market
behavior information. Firstly, the gain was very small, barely clearing the
previous swing high, and the bars were very small in range. The small ranges
indicate resistance overhead, preventing price from rallying higher.
Secondly, this is the first time that price went substantially below the previous
swing high. Note how price stayed well above the first two swing highs. Look
back at the daily chart, and you will see that the past five trading days have
been moving sideways and not gaining higher ground. That, in itself, is a
sign of weakness.
The unanswered question is to what extent will the market correct? Just a
minor correction, as has been the mode of this Fed-POMO-induced rally? It
is always possible. We lean to a larger correction than has been experienced
since the March lows, and possibly even a resumption of the down trend. The
answer to either is less important for preparation for even just a correction will
position us to stay with a more protracted decline should that prove to be the
case.
If supply does not come in soon, like NOW, then expectations for even a
minimal correction are the most one can expect. We simply wait to see what
develops, and how, and respond accordingly. There is no need to guess. The
preparation process will handle whatever develops, so the element of surprise
is minimal.
The 1077 area may be key. If price exceeds it, and on strong volume, expect
much more downside in both time and price. For now, we take it one day at a
time.


