Monday 13 October 2009
Even a simple “normal” correction is hard to come by. Yet another interesting
day as the markets made varying degrees of a high. Let’s start with the tech
heavy index, Nasdaq, which has been the leader of this rally. It had a key
reversal retest day, [KR = higher high, low-end close and the close lower than
the previous day], testing the KR absolute rally high of 23 September, also a
KR day. This is a failed KR retest of a KR high, a red flag by most anyone’s
standards.
The Dow, widely recognized but the least followed, clearly made new highs
today, but it closed on the lower end of the range, telling us that despite the
new highs, sellers were present and won the “battle” that day. Buyers are
supposed to be in control at market highs, and the close should be nearer the
top of the range. Another red flag.
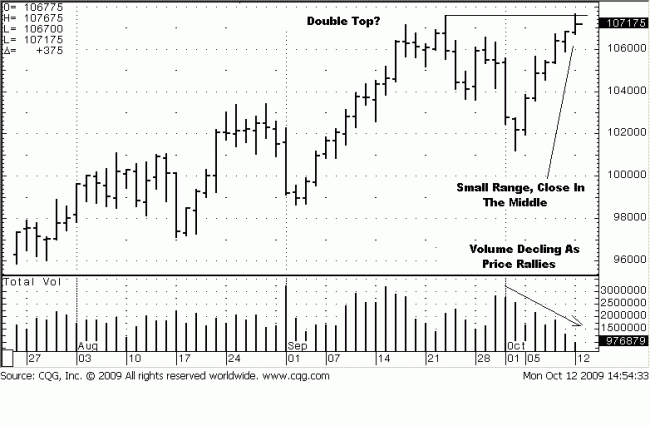
To the most popular index, the S&P. Where the Nasdaq made a lower retest
high, the S&P put in a double top, but not just any kind of double top. Note
the range of the bar at today’s high in the chart below. It is relatively small,
and it only exceeded the 23 September high by 100 tics, hardly bragging rights
for the bulls. Then there is the important close that let’s us know who is in
control. Wait! A mid-range close; a draw between the forces of supply and
demand…no one was in control when the ball was in the demand’s court. Red
flags all around. At any kind of high, we know who should be in control, and
when it is not being exercised, there must be a reason.
There has been no shortage of caveats warning of technical weakness, at
least in the character of the rally, but not in rally results that have continued
higher unabatedly despite the warnings. These red flags that produce no
corrections run the risk of sounding like the little boy who kept crying “Wolf”
when none was around, but this is real world and not another fairy tale. Just
ask those who ignored the warning of the 2007-2008 rally top and did not get
out in time.
The markets are different in that they require patience. What we are describing
is activity that you can see unfold before your eyes, day-by-day, a front row
view to present tense activity. No one can know how the next day or week will
unfold because it has not yet occurred. However, the market advertises its
intent in the clues it leaves behind. It is a matter of reading them, and we are
giving you a glimpse of what it is like in order to make an informed decision
that reduces risk exposure.
A comment was made in a recent article that demand has not been all that
great, judging from the volume levels, and supply is virtually absent. By supply
being absent is meant a wide range bar down on strong volume, like
1 September. The lack of downside follow-through implies lack of supply. We
covered a volume explanation in a previous article, S & P – An Anatomy Of A
Trade , from 6 October, to put the character of the market into a context in
order to assess the strength of the existing trend. The trend is up, but not
without problems, at least from our point of view.
September started a chain of ten consecutive higher closes. October just
registered its 6th higher close, but 7, 8, 9, and 10 appear problematic for
reasons just given, present and past. And then there is that pesky lack of
volume. Notice how it has declined as price rallied to the current double top.
Think of volume as the fuel needed to move a market. What has been the
level of fuel to push this market higher? Add yet another red flag to this
POMO rally.
Of course there is always another measure. If the indices are so strong,
why are most people’s individual portfolios faring so poorly, many still under
water after a “substantial” rally in the indices? The dilemma becomes more
and more apparent as the litmus test of the market’s health continues to be
measured.
Based on the trend, sans any character analysis, this market should head
higher. over the 1100 area. Based on a character analysis, it is hard to ignore
the continuum of red flags, and this market stands exposed to a correction,
either at least a third of the July to present rally, or a resumption of the still
major trend that points down.
Today was the first time in three days that a day session gap higher open was
closed. In other words, the day session has been opening above the previous
day’s close and price not going back down to the previous day’s close. Today
it did. Small, but throw in another red flag.
Sometimes it is hard to be bullish in a defined up trend. This is one of those
times. Still watching without being long, and without reason to be short. Safe
and not sorry.


