Tuesday 29 September 2009
We are of the mind that the S & P is changing from an up trend to at least a
sideways direction, in a transition to a renewal of the down trend. Market activity
appears to be indicating such a change.
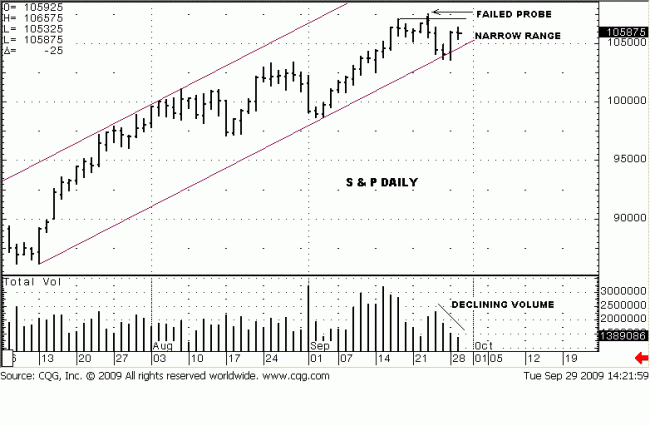
As a reminder, the high was on 17 September in both SPY and futures. A double
top occurred in SPY on last Wednesday, the 23rd, whereas the futures made a
failed probe, which is a new high but a close back under the previous close and
high. [See chart]
A probe is used to see what lies above the previous high. Is there more demand? Are there resting stops overhead? If there are, the probe upward will uncover the
new demand and trigger stops from short-covering of weak hands. If there is little
of, or no demand, price will come right back, “failing” to sustain the lack of new
demand, so it declines based on a lack of demand and some new selling. This is
what causes price to close low end, as it did on the chart below. Note that volume
was highest on the failed probe, so it cleared out all the stops and trapped any new
buyers.
Speaking of volume, we reiterate that the answer to the lack of supply coming into
the market, of late, has already been addressed by the volume activity between
the 9th and 17th of September. You can see the flurry of volume activity during
that span. It reflects smart money unloading their longs under cover of the rally
because it takes time to unload their line of long positions. Remember, smart
money does not want the public to know what they are doing, for obvious reasons,
and they try to hide their activity as best they can.
Nice try.
The review is made to keep current market activity in a context of the ebb and flow
of movement for it is all related, or can be explained to relate in a fluid context.
We recommended short positions at 1059, today, as price rallied in early
afternoon. We viewed the rally as a failed attempt to retest the previous high and
the probe. The day was narrow in range, an indication that sellers are active
sufficiently to keep what buyers remain from taking price higher. Also, the day
went above yesterday’s rally, BUT, similar to the described failed probe, the rally
found no buyers willing to participate, and price began to sell off, gradually, going
into the close. [Price was 1058.75 when we wrote this, the close was 1055]
See how on Friday and Monday price broke the established trendline connecting the July and September lows? It was only by a little bit, but it is a minor sign of
weakness when the market should be exhibiting nothing but strength. It does not
signify a change in trend, so do not read anything more into it. It is what it is, but
within the context of the market’s “story” as we are relating, these little pieces of
the puzzle add up.
Will the market just drop from here?
Not likely. It needs to develop a further base from which to distribute. We see
that process as having begun a few weeks ago, as described in volume activity, and if we are correct in reading the message of the market, a break under 1035 can be
very damaging, and it may be enough to say the up trend has ended. However,
that has not yet happened, and new highs remain a possibility, so as we have been
following activity throughout, as a guide, we will continue the same in moving
forward, one day at a time.
It could be we are early in getting short, but the location, 1059, limits the risk
exposure, and it gives an edge, something we recommend highly when
establishing a position. Tomorrow, Wednesday, is the end of the 3rd Quarter. The Quarterly chart still looks positive. The quarterly trend is down, important to know,
but the 3rd Q bar just ended is a positive up bar.
We know what to look for in managing the current short position. Future market
activity will add more clarity as it develops. The trend may be changing. Buyer
beware!


