Monday 7 September 2009
We are going to lean on the weekly market behavior and remain neutral with the idea that price may begin to fail in this trading range. Whenever price is in the
middle of a trading range, the level of knowledge is at the lowest level for making
informed decisions. That has been the case here.
Why lean on the weekly?
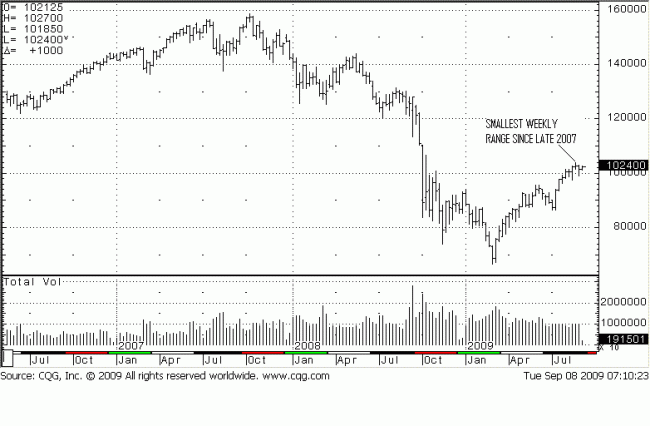
The week ending 29 August was the smallest range, high to low, in over a year and a half. This becomes the most significant piece of information for the message it
contains. A small range at the top of a rally is most often a form of stopping
action, as in stopping the trend. The range is small because sellers were present
and prevented the range from extending higher. In addition, the close for the week was mid-range, and that says the battle between buyers and sellers was a
standoff.

There is support to this premise found in the daily chart, for Friday’s 29 August
trade activity was a failed probe to the upside, [a new high with no upside follow through that reverses and closes lower], on light volume. This tells us there were
very few buy stops above 1035, either in weak short covering or in new buying of a
higher price. That fact was confirmed the following Monday, 31 August, when price
declined on the highest volume in many weeks, indicating potential supply coming
onto the market. The only caveat to that, once again, is the lack of downside
follow through, so far.
Additionally, there was a cluster of closes during that week, and this alone can
signify at least a temporary stopping of a trend. In trading, as in politics,
everything happens for a reason. The difference in trading is that at least the
reasons are factual and reliable.
In a strong trend, as the S & P has been in since 6 March 2009, buyers are in total
control, especially when making new highs, but as was just described, it appears
that buying was spent, which is a hard statement to make when the Fed fed money to banks to buy stocks is virtually unlimited. Also, the close for the week was only
marginally higher than the preceding week, and Friday’s pre-holiday weekend close
was under the previous two weeks and just below the low of the week ending 29
August.
That being said, here come the caveats. In an up channel from the March lows,
connecting a trend line with the July lows and then drawing a line parallel to it, price is in the middle of that channel. While price is holding below the upper poartion of
the channel, it is also failing to move lower toward the bottom portion of the
channel, which would indicate weakness. the same holds true on a daily chart.
On intra day charts, a recent support line, up from the mid-July lows, has been
broken, a sign of weakness to a certain degree, but the intra day charts are
showing more of a sideways move than moving lower putting price pretty much…
in the middle!
Here are the more cogent facts for making an informed decision: the monthly,
weekly, and daily trends are up. Of that there is no dispute. The intra day trends
are now sideways, having almost turned down on Friday, but the smaller time
frames are of less force and influence. Those are the pros.
The only con, besides the Fed efforts, is the unusally small range that formed the
high, along with the supporting location of the closes already mentioned. However, that one little con can be the stopping action, as noted, and that can/may negate
all the other positives.
If already long, one has to stay with the trend. Monitoring any long positions with a closer stop may be warranted, should price weaken instead of showing strength.
There is no reason to be short for the stoping action has not yet been confirmed.
the tipping point will be seen in present tense market activity that develops this
weeks. Keep in mind, September is often a negative month for stocks, but that is
a generality. That one little bar on the weekly chart stands out like a beacon on
the shores of Cape Hatteras and may be the Big Tell.

Price has room to go to the 1100 – 1125 area to the upside, and 860 to the
downside, although the 950 area will have a lot to say about if, and how far down
price can go. The key to the current situation will be how price responds to the intra day support and resistance points, and then how subsequent market activity
develops. That is where we focus our attention in order to now how to best
proceed.


