

Last week we were talking about a good-looking bounce in the S&P 500 e-mini futures contract, but fretting about a couple of things that made us cautious. After the usual back-and-forth – nothing is ever simple or clear-cut in the market – we reached this conclusion:
The resistance around 1623-25 is the key. If the futures can manage to close above that level, the market should move higher. If the ES can’t fill the gap and move past that level, we will be looking for short-term entries on the short side.
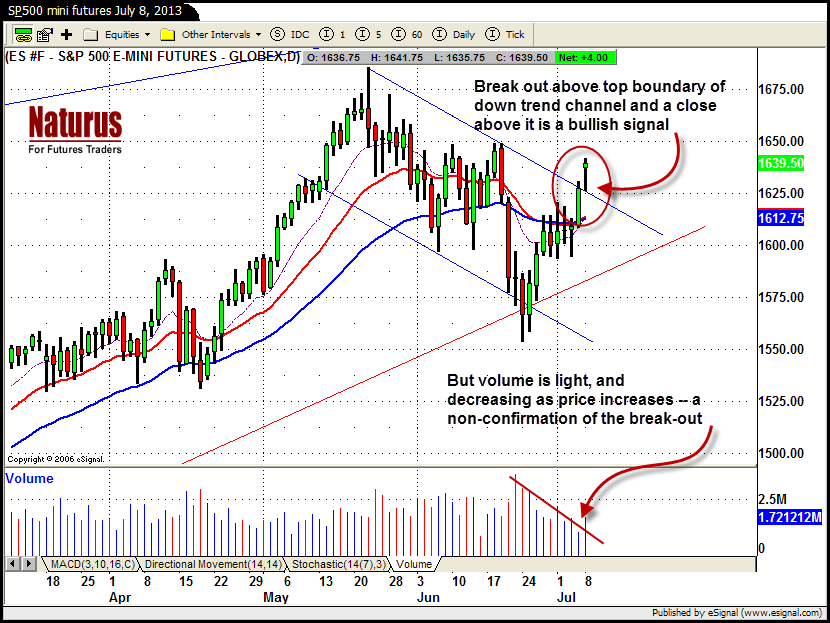
On Friday the e-mini contract closed the gap; yesterday it confirmed the bounce by closing above the top boundary of the current downtrend channel – a classic break-out through previously-solid resistance and a strong bullish signal.
BE CAREFUL WHAT YOU WISH FOR
We got what we wanted; but this break-out still looks a little suspect to us. Here’s what is still causing us concern:
• True break-outs are usually accompanied by increased volume; this one isn’t. In fact the volume is increasing on down days, not on the breakout.
• The daily range – the distance between the high and the low for the day – is also decreasing. True break-outs are characterized by accelerating price movement and an expanding range. This on just posted the smallest daily range in the past seven days.
• On the intra-day chart (not shown) the market moved into a short-term consolidation phase that is setting up the next accelerating price movement. We’re just not sure it will be up.
It is possible we are seeing a bull trap; the price may move up, then suddenly stall and reverse quickly back below that broken resistance line 1631.25 to trap the buyers.
Figure 1 Title: S&P 500 e-mini futures contract as of July 8, 2013.
WHAT TO DO NOW
Our fundamental stance is bullish. If we see the price move above 1648 – 49 we will regard that as confirmation that the downside correction is finished and the bulls are back in control. We will then be looking for the price to return to the previous high at 1685.75 – forming a double top – and perhaps move beyond that level to make a new high.
Conversely if this is a bull trap and the price moves below 1635.50, it may return to test the broken resistance around 1623-25. We will be buyers at that level or below.
= = =
Polly Dampier is the brains behind Naturus.com, where she gives active traders real-time market guidance. For more information on her index futures trades, visit www.naturus.com

