Monday 26 April 2010
Last time, we were on the short side of the market, but when there was no
downside follow-through to the decline that started on the previous Friday,
the 16th, the fast turnaround on last Monday, the 19th, told us the market
would be in a trading range, at a minimum. The retest and high-end close
on the 22nd told us that the odds for new highs were more favorable. We
got long at 1203.50 on Friday, just in case.
Throughout most of Friday, the potential of a trading range kept price
contained. For that reason, we exited half the position at 1207, letting the
balance run. By the end of the trading day, the remaining position enjoyed a
good edge. Stops have been moved to 1209.50, should price reverse, giving
a risk-free trade, everyone’s favorite kind.
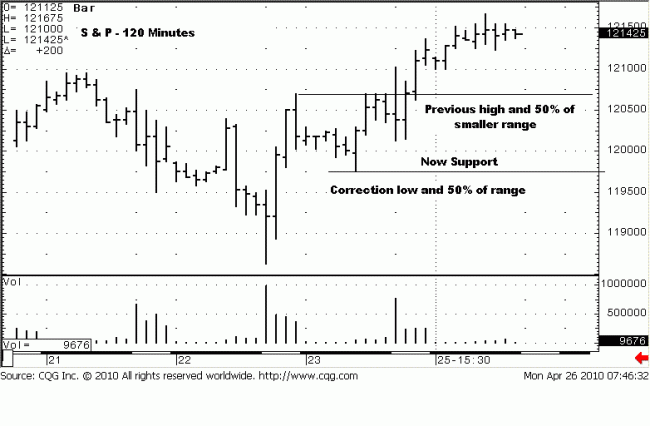
We have included a 120 minute chart to focus on the shorter term, for price
can still go either way from here. The bias remains to the upside, but quick
corrections have been ever present and need to be respected. The correction
low at the 1197.50 is also a 50% retracement of the range from 1180 to today’s
pre-opening high of 1216.75.
There was a rally high at 1207, the other day, and that, too is about 50% of
the smaller trading range. Both lines drawn show what could become support
on any correction, near term. To not have too many lines drawn on the chart,
the high from 15 April, the 1210 area could be the most important initial
support if price continues to rally today.
As always, it is important to watch HOW price responds/reacts to designated
potential support areas to get a clue whether or not the potential support will
hold. Flexibility may be key at these high price levels.


